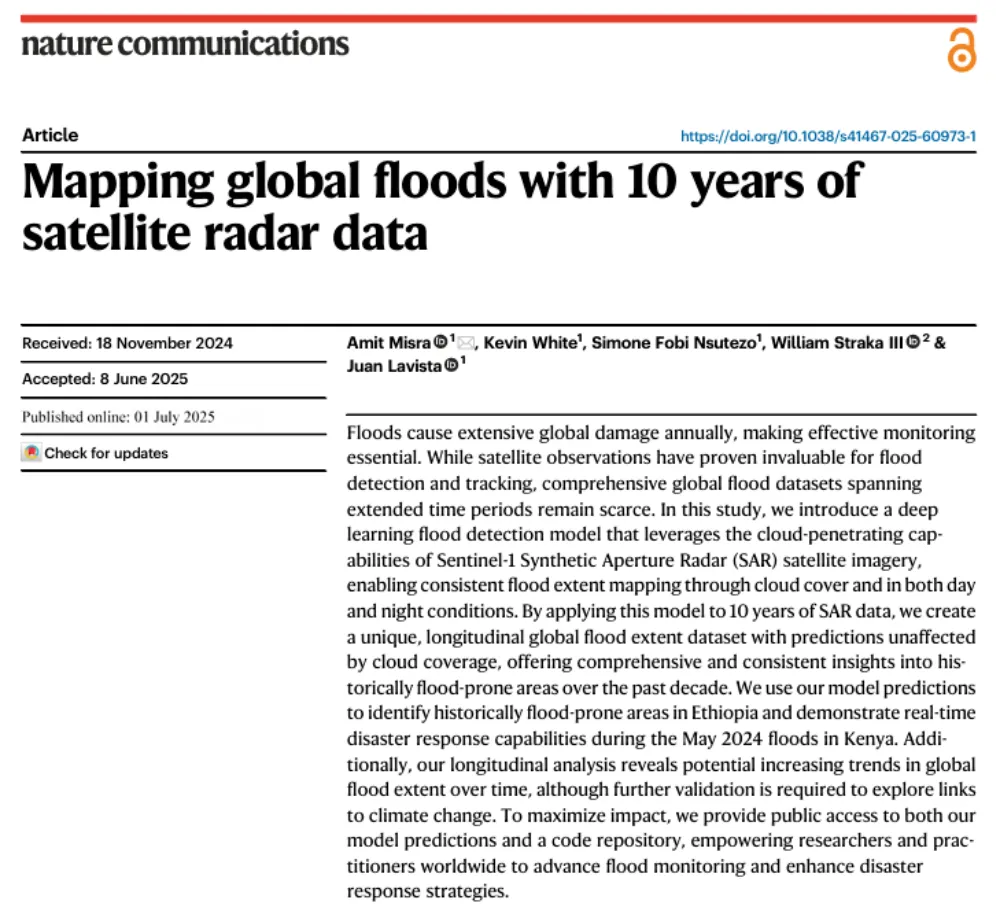
Key takeaway: Several global flood datasets already exist, but their long-term records rely primarily on optical remote sensing from satellites such as MODIS and Landsat. Yet the most severe floods often occur under thick cloud cover. The real question this study seeks to answer is not “How can we detect floods one more time?” but rather: Can Sentinel-1 SAR, which is unaffected by clouds or daylight, be used to rescan the entire world for floods between 2014 and 2024 and create a global flood database for historical risk assessment, emergency response and long-term trend analysis? The authors ultimately developed a MobileNet-based change-detection model and applied it to 10 years of Sentinel-1 data to map historical global flood extent. Compared with existing MODIS and Landsat datasets, the study identified approximately 71% more historical flood-affected areas.
1. The paper is not really about “flood detection,” but about consistent global, long-term flood observation
Judging from the title alone, it would be easy to interpret this paper as yet another study on “deep learning + SAR flood classification.”
But the problem it addresses is much broader than the detection of a single flood event.
Many methods already exist for extracting flood extent from satellite imagery. What is still missing is a multi-year flood record that operates at the global scale, remains as consistent as possible over time, is minimally affected by weather, and is generated using a unified methodology.
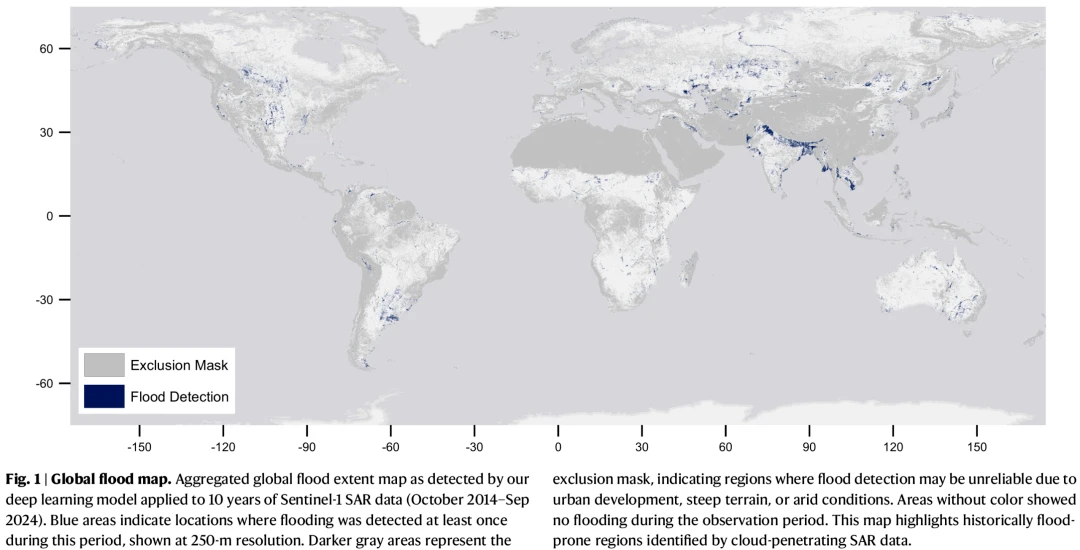
MODIS has been used to build global flood records. Its strengths include broad coverage and high temporal resolution, but its spatial resolution is relatively coarse. Landsat-based Global Surface Water can provide long-term information on changes in surface water at a 30-meter scale, but it still fundamentally depends on optical and near-infrared observations.
The problem appears precisely when floods occur.
Flooding often coincides with intense rainfall and heavy cloud cover. This creates a very practical contradiction:
The more urgently we need to see a flood, the more likely optical satellites are to see nothing at all.
SAR is different. Sentinel-1 actively transmits microwave signals, does not rely on sunlight and can penetrate most cloud cover, allowing it to operate both day and night. Some previous studies have even shown that, with the same number of satellites, Sentinel-1 can observe approximately 58% of flood events, while optical Sentinel-2 captures only about 28%.
Therefore, the question posed by this paper is not:
“Can SAR detect floods?”
That question has already been studied extensively.
The real question is:
If SAR is particularly well suited to flood observation, why is there still no SAR flood-history database covering the entire globe over multiple years, comparable to the MODIS or Landsat records?
That is the gap this paper seeks to fill. The Copernicus Global Flood Monitoring service had already begun using SAR for flood monitoring, but it focuses more on individual events and near-real-time products. It does not primarily address questions such as where floods repeatedly occurred around the world over the past decade, or whether flood extent has undergone long-term changes.
2. The authors’ idea is straightforward: Instead of asking “Is this water?”, ask “Is this newly emerged water?”
This paper does not treat flood detection as a simple water-body classification task based on a single SAR image.
Instead, the authors use:
Change detection.
In other words, the model examines Sentinel-1 images acquired both before and during a flood.
The logic is simple.
If a river or lake already existed before the disaster, it may appear equally dark in SAR imagery, but it should not be classified as flooding.
What should actually be detected is:
An area that was not water before but suddenly begins to exhibit SAR characteristics associated with water.
The authors therefore use paired pre-flood and post-flood SAR images. By comparing changes in backscatter, the model determines where new inundation has appeared. The paper deliberately uses one pre-flood image and one post-flood image rather than continually adding more historical images. Previous studies have shown that adding additional pre-flood images generally improves the F1 score by less than one percentage point while significantly increasing computational costs.
This may appear to be merely a change in the model’s input format, but it is highly significant for global flood mapping.
If the model directly identifies “water,” permanent lakes, rivers and certain naturally low-backscatter surfaces will repeatedly enter the results. Change detection, by contrast, focuses on:
Where a surface has changed from a non-water state to a water state.
The core of this paper is therefore not single-image semantic segmentation, but:
Temporal change + water-body physical characteristics + deep learning.
3. The model does not feed raw SAR data directly into a CNN; it first tells the model which changes are more likely to represent flooding
The paper uses a MobileNet early-fusion change-detection model.
MobileNet itself is not the most important aspect of the work.
The authors selected MobileNet mainly because it is lightweight enough for inference across massive volumes of global imagery and can be operated by users with limited computing resources. The more important issue is how the model inputs are designed.
The authors did not simply feed the model the raw pre-flood VV, post-flood VV, pre-flood VH and post-flood VH channels.
Their experiments showed that:
Constructing physically meaningful change features based on the typical SAR backscatter range of water was more effective than relying entirely on the network to learn from raw amplitudes.
The final model mainly uses four types of inputs:
Change indicators showing whether VV and VH have entered the backscatter range typically associated with water, together with the magnitude of backscatter change in the VV and VH polarization channels.
The typical water-body thresholds used in the paper are approximately:
- VV below −17.5 dB
- VH below −22.5 dB
The underlying logic is worth examining closely.
The model is not simply asking:
“Is this pixel dark enough after the disaster?”
It is also asking:
“Has the pixel become significantly darker than before, and has it entered the range typically expected for water?”
The magnitude of backscatter change further helps the model distinguish between:
Small fluctuations caused by normal noise and large changes genuinely caused by flooding.
Thus, although the paper uses deep learning, it is not a completely black-box, end-to-end system.
Instead, it encodes prior physical knowledge of SAR water-body characteristics into the features before allowing the neural network to make more complex spatial judgments.
4. The most important engineering challenge was not missed detections, but the accumulation of false floods after processing 10 years of global data
This is the key to understanding the paper’s innovation.
If a model processes only one flood event, the occasional appearance of a few false water detections may not be particularly serious.
But the authors set out to:
Process all Sentinel-1 images collected across the globe over a period of 10 years.
That changes the problem completely.
Suppose a pixel has only a very small probability of being falsely classified during any individual observation. If it is observed often enough, however, there is still a substantial probability that it will be incorrectly classified as flooded at least once over the course of a decade.
As a result:
A small number of false positives that may be acceptable in a single event can become extensive areas of “historical flooding” in a 10-year global accumulation map.
For this reason, the authors did not equate the neural network’s output directly with the final flood product. Instead, they built a dedicated false-positive filtering system after model inference.
One of the most difficult issues in SAR is that:
Dark does not necessarily mean water.
Arid bare ground may appear very dark because of low backscatter. Mountain radar shadows are also dark. Freeze-thaw processes can create changes resembling inundation, while complex vegetation and urban areas can interfere with SAR signals.
The authors therefore incorporated land cover, a digital elevation model, soil moisture and land-surface temperature.
ESA land-cover data were used to identify bare ground and permanent water bodies. The digital elevation model was used to identify complex terrain with slopes greater than 10 degrees. Soil-moisture data helped filter false positives in extremely dry environments, while land-surface temperature helped address freeze-thaw effects.
The authors initially attempted to feed soil moisture and terrain directly into the neural network. However, because the training samples were insufficient and soil moisture itself has a spatial resolution of only about 10 kilometers, they ultimately found that:
Instead of forcing the network to learn from coarse-resolution variables, it was more effective to use them as post-processing rules.
This is arguably more valuable than the use of MobileNet itself.
The authors were really solving the following problem:
How can a single-event SAR flood model be transformed into a global flood-production system capable of running continuously for a decade?
5. The exclusion mask is not simply a mask; it tells users where the global flood map can be trusted and where caution is required
The authors took another highly practical step:
They did not pretend that the model was equally reliable everywhere in the world.
The paper establishes an exclusion mask, or exclusion/low-confidence mask, for areas where results should be treated cautiously.
Bare ground, steep terrain and nearby areas are considered to have a higher risk of false positives. In urban built-up areas, false negatives are more likely because buildings can obscure the ground surface from the SAR signal.
These areas are not simply deleted from the dataset. Instead, the final product explicitly tells users:
The SAR flood results in these areas are less reliable and require additional verification.
This is easy to overlook, but it is a highly valuable design choice for flood-remote-sensing research.
Many remote-sensing papers ultimately provide only:
Flood / Non-flood.
In real-world applications, however, the more important question is often:
How trustworthy is this Flood classification?
The paper does not yet establish a rigorous pixel-level probabilistic uncertainty model. But through the exclusion mask, it at least separates:
The model result
from
The model’s range of applicability.
This means the final product is no longer merely a flood map. It is closer to a data product designed to support operational decision-making.
6. How accurate is the model? Its defining characteristic is not extreme conservatism, but a strong effort to avoid missing floods
The authors first evaluated the model on an internal test set.
They obtained:
- IoU = 0.67
- Precision = 0.68
- Recall = 0.99
- F1 = 0.80
The most notable result is not the F1 score, but:
A recall of 0.99.
In other words, on the authors’ own test data, the model detected the vast majority of actual flooded areas.
The cost was a precision of only 0.68.
Put simply:
The authors preferred to capture as many potential floods as possible at the first stage, then use soil moisture, elevation, temperature and land-cover data to filter out false floods. They did not want the neural network to miss large numbers of real floods at the initial detection stage.
This model design is consistent with the goal of global application.
Once a flood is missed, post-processing has almost no way to recover it. False detections, by contrast, can still be filtered using multiple types of auxiliary data.
From a system-wide perspective, the authors adopted the following approach:
High-recall flood candidate extraction → Multi-source constraints to reduce false positives.
The goal was not to make the CNN independently produce a perfect final classification.
7. To demonstrate that the model was not effective only in its training regions, the authors tested it again on 43 floods worldwide
If a paper performs well only on several training events, it cannot easily support a claim of global flood mapping capability.
The authors therefore introduced the Kuro Siwo global flood dataset.
This dataset covers:
- 43 flood events
- Six continents
- A range of climate zones
It also contains manually labeled pre-flood and post-flood Sentinel-1 imagery, making it particularly suitable for evaluating the change-detection approach used in this paper.
On the Kuro Siwo test set, the paper’s AI4G model achieved:
- Precision = 0.84
- Recall = 0.72
- F1 = 0.77
- IoU = 0.63
Under the same comparison, Copernicus Global Flood Monitoring achieved approximately:
- Precision = 0.73
- Recall = 0.70
- F1 = 0.72
- IoU = 0.56
The model trained specifically by the Kuro Siwo authors achieved an F1 score of approximately 0.75–0.80.
The results suggest that the model’s ability to generalize globally was at least comparable to models trained specifically on Kuro Siwo and higher than the GFM results obtained using the corresponding thresholds in the paper.
However, the authors make an important qualification:
The original Kuro Siwo method was designed as a multi-class task, whereas this paper treats the problem as a binary Flood / Non-flood classification task. Therefore, the F1 scores of the different models should not be interpreted as a completely strict, apples-to-apples ranking.
That qualification is worth preserving in any review of the study.
8. The major result: Ten years of Sentinel-1 data increased the mapped global historical flood extent by 71%
After completing the model, the authors applied it to:
Ten years of Sentinel-1 SAR records from October 2014 to September 2024.
The model performed flood inference at an effective scale of approximately 20 meters. The global visualization was downsampled to 250 meters for display.
The most important result of the paper then emerged.
Compared with Landsat Global Surface Water and historical MODIS flood data, the historical flood-affected areas identified in this study were:
Approximately 71% greater globally.
For Africa, the increase was:
Approximately 90%.
For Ethiopia:
Approximately 194%.
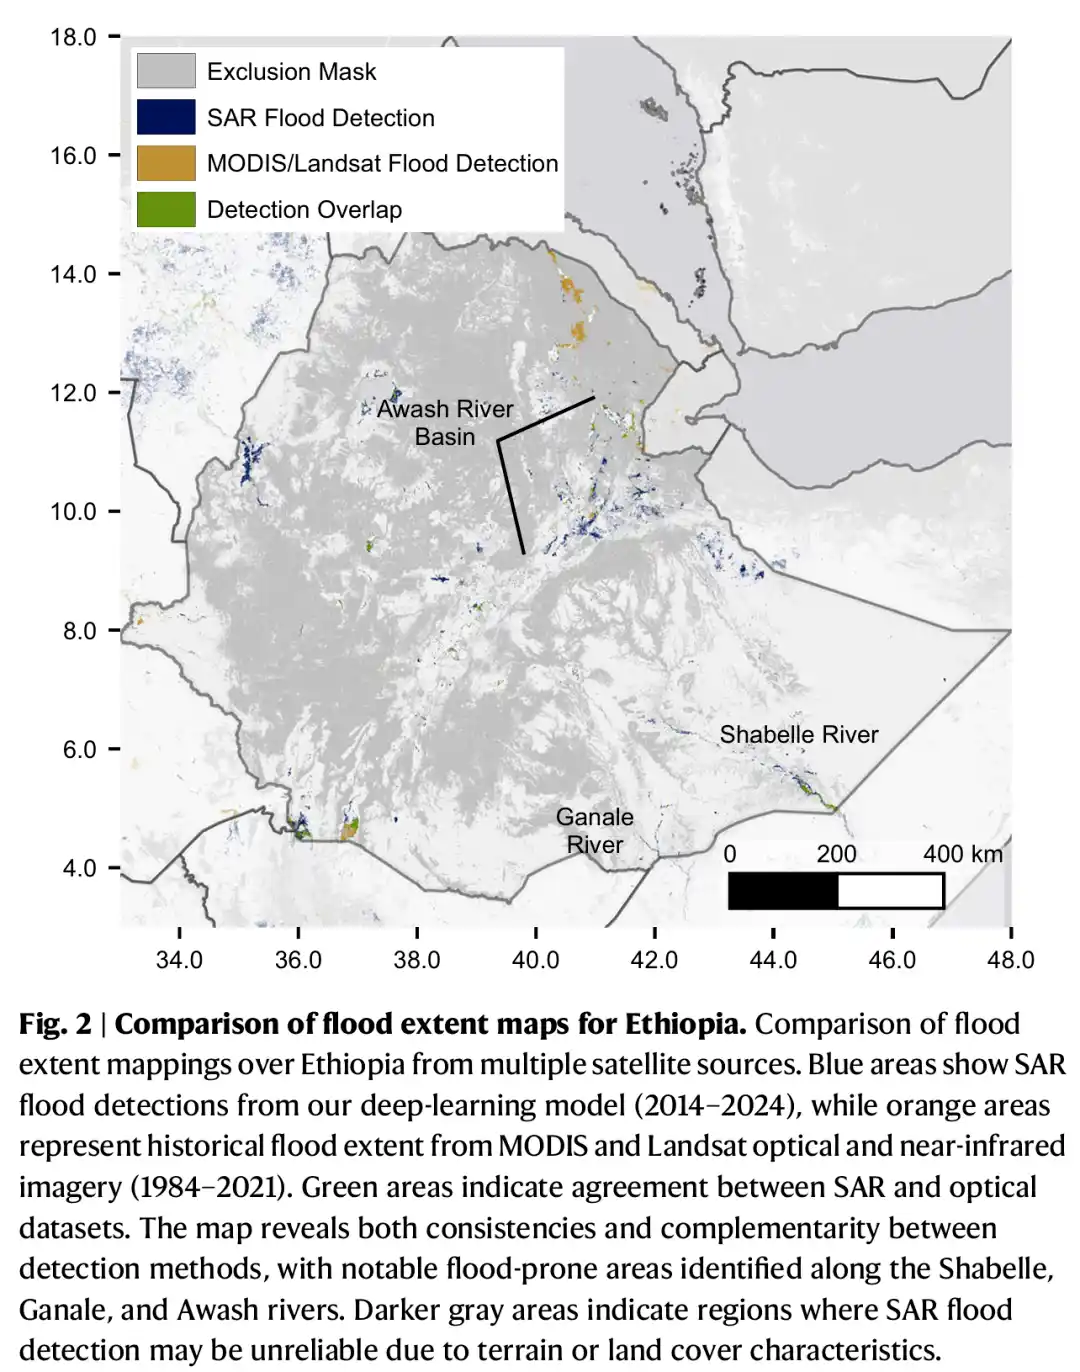
For the Semera region:
Approximately 96%.
For Dolo Ado:
Approximately 1,013%.
This result requires an important qualification:
It does not mean that the previous MODIS and Landsat methods were “wrong by 71%.”
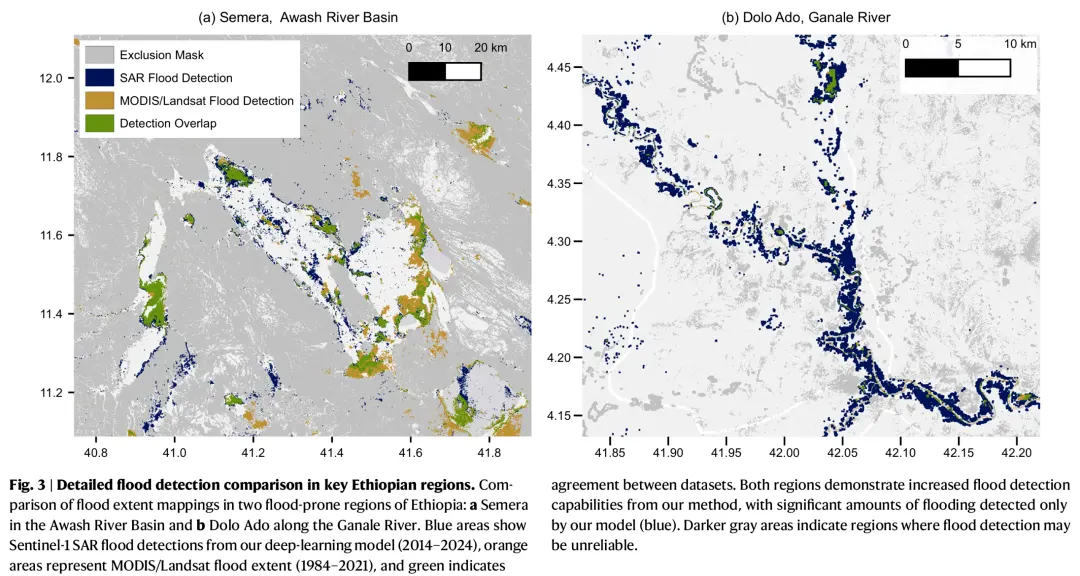
The datasets differ substantially in their coverage periods, spatial resolutions, revisit frequencies and sensors. It would therefore be unreasonable to expect them to overlap perfectly.
The real significance is that:
Sentinel-1 can observe floods during many periods when optical sensors are obstructed by clouds, filling in a portion of the flood history that was missing from earlier long-term databases.
The authors also emphasize that Sentinel-1 and the existing datasets overlap substantially in time. The additional flood areas cannot be explained entirely by the fact that Sentinel-1 extends the record to 2024.
Even during the periods observed by both types of datasets, SAR identified a considerable number of flooded areas that had not been recorded in previous optical databases.
That is the real significance of the “71% increase.”
9. The Ethiopia case shows that identifying more floods can directly change risk assessments
The paper does not stop at asking:
How many more square kilometers of flooding did SAR identify than optical data?
The authors also ask:
What do these additional flooded areas mean for real-world risk assessments?
In Ethiopia’s Semera region, the flood map produced in this study showed that approximately 19% of farmland was located in areas that had experienced flooding in the past.
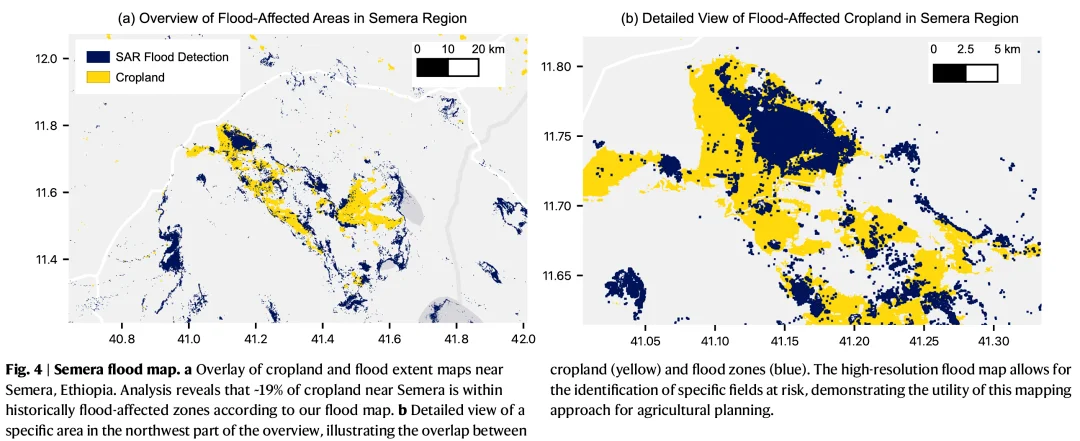
The corresponding proportion was approximately 7% using Global Surface Water and only about 2% using MODIS.
The difference was even more pronounced in Dolo Ado:
This study estimated that approximately 52% of farmland was located in historical flood-affected areas, while existing datasets produced estimates of only about 1%–3%.
This shows that the improvement is not simply a matter of drawing more blue areas on a map.
It directly changes judgments about:
Which farmland is exposed to risk, where infrastructure should be deployed, and where future flood-control resources should be directed.
This is why the paper’s contribution cannot be summarized simply as:
“A flood-segmentation model was proposed.”
A more accurate description is that the authors established a complete application chain:
Satellite observation → Global flood-history records → Risk-exposure analysis.
10. The 2024 Kenya floods show that the same model can be used not only to look back over 10 years, but also for real-time disaster response
The authors then used the 2024 Kenya floods to demonstrate another capability.
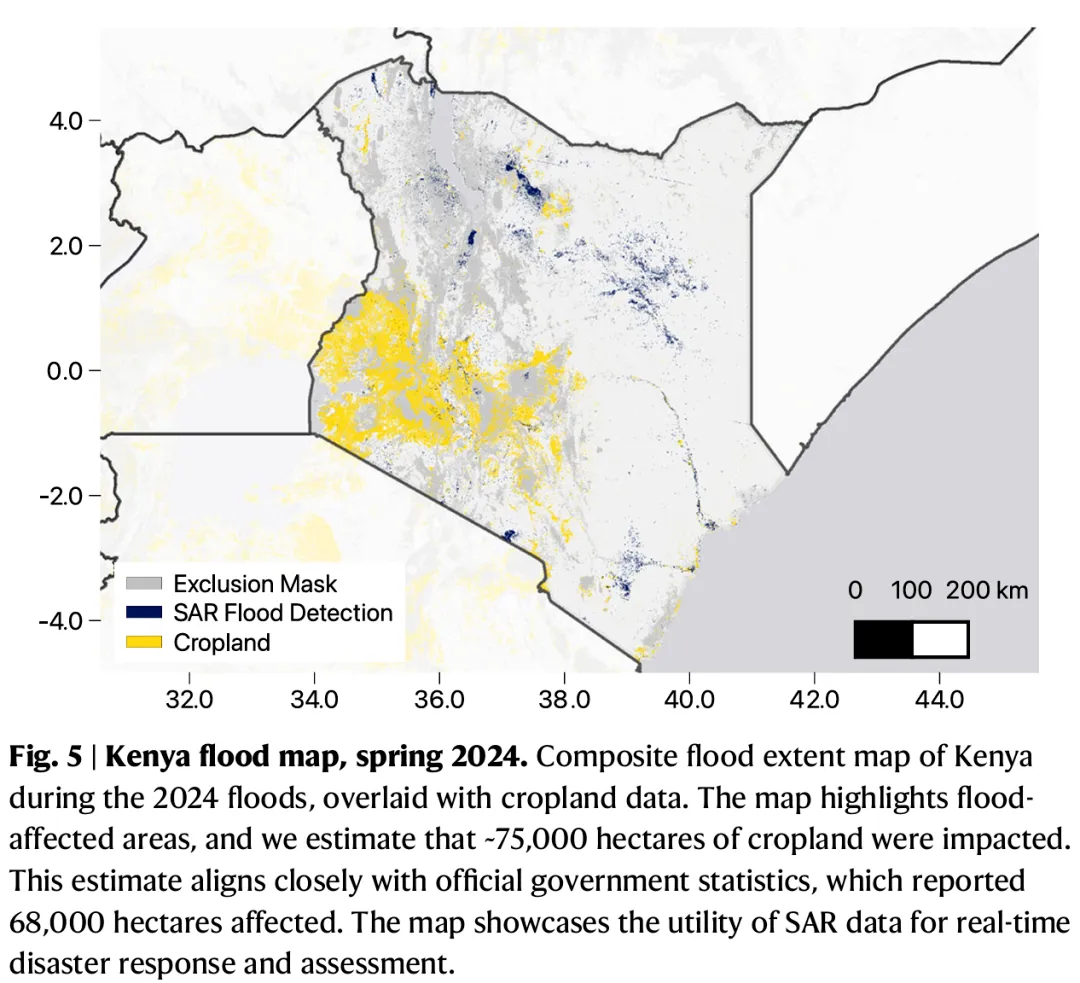
During the floods, the team worked with local Kenyan institutions to continuously update the flooded areas using the model, with minimal need for extensive manual intervention.
Between March and May 2024, the authors aggregated multiple monitoring results and overlaid them with farmland distribution.
They ultimately estimated that:
Approximately 75,000 hectares of farmland were located within or very close to the flood-affected areas.
The Kenyan government’s publicly released figure was:
Approximately 68,000 hectares.
The two estimates were of a similar order of magnitude.
This means that the same system effectively completed two tasks:
Looking backward, it reconstructed a 10-year flood history.
Looking forward, it rapidly generated flood extent after a new disaster occurred.
This is one of the paper’s strongest engineering contributions.
Rather than building separate “historical” and “emergency-response” models, the authors sought to make the same SAR change-detection system serve both:
Historical baseline + Rapid response.
11. Why did the authors also analyze whether global flooding is becoming more frequent?
This may be the most ambitious—and most easily misinterpreted—part of the paper.
Once the authors had a decade of global flood detections, they attempted to answer another question:
Has satellite observation directly revealed an increase in global flood extent?
Many previous studies of global flood trends relied on:
- Disaster reports
- Population exposure statistics
- National reporting records
These data have clear limitations.
When a country’s reporting capacity improves, an increase in the number of recorded floods does not necessarily mean that the actual number of floods has increased.
Sentinel-1 provides at least a relatively consistent observation system.
The authors aggregated global flood area by month and normalized the results according to the actual number of SAR observations available during each month. This is important because after one Sentinel-1 satellite stopped operating at the end of 2021, the number of global observations fell significantly. Without normalization, it would be easy to mistake a decline in the number of satellites for a decline in flooding.
The authors then controlled for seasonality and built a linear trend model.
The results were:
Using all data:
+6% ± 2% per year, p = 0.0005
After excluding the unusually high values after 2022:
+5% ± 2% per year, p = 0.01
After also excluding 2022 and data collected before June 2017:
+2% ± 3% per year, p = 0.5
The authors consider the second scenario—
An increase of approximately 5% per year—
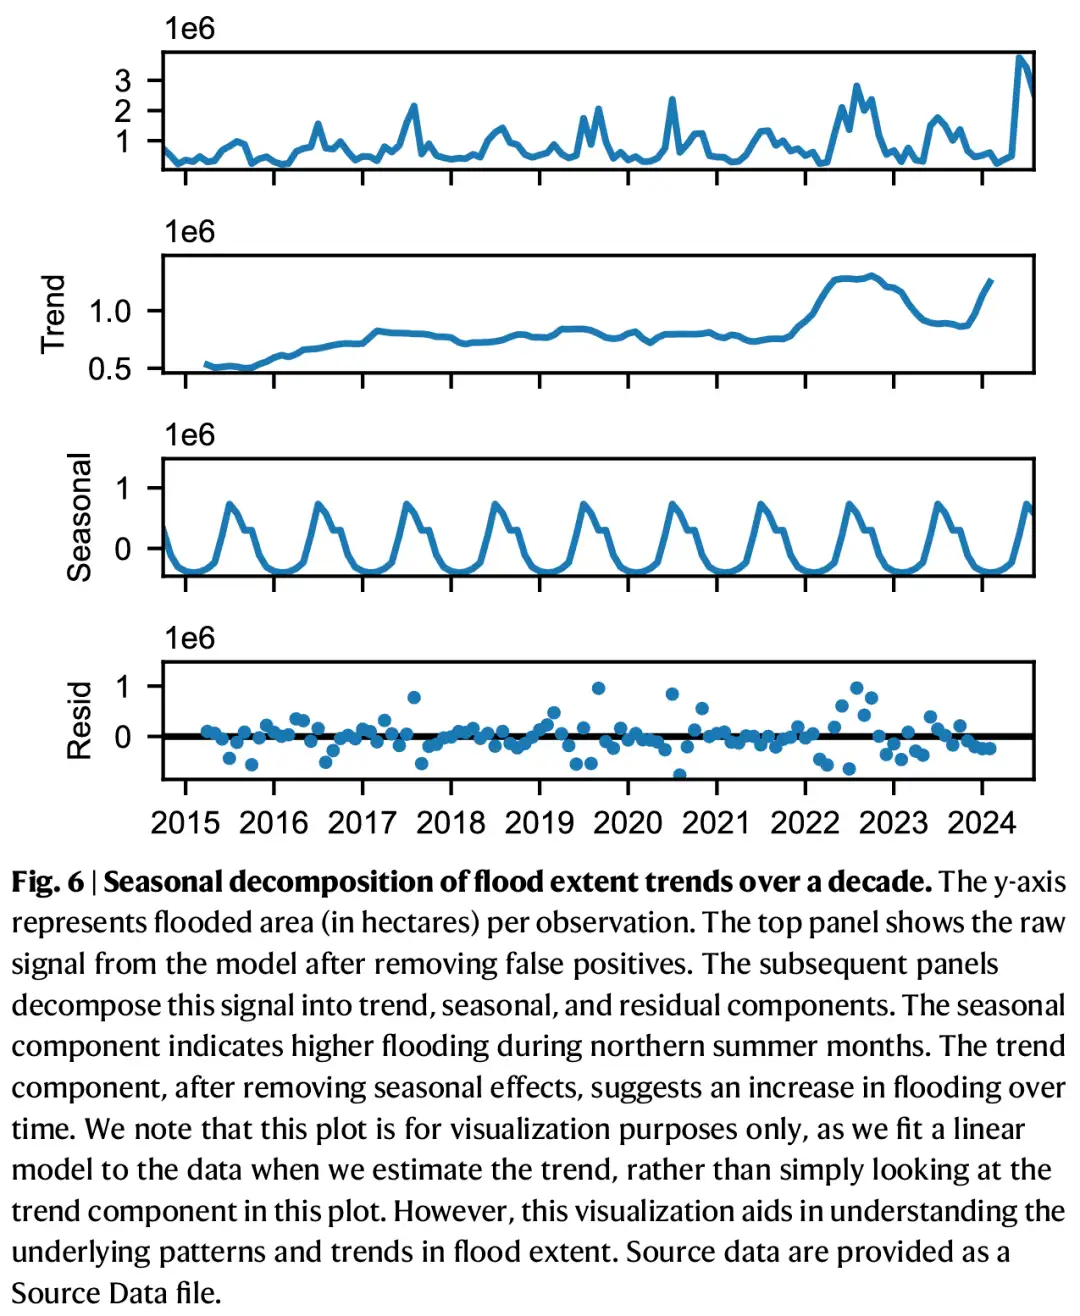
to be the most reasonable estimate at present.
12. But “flooding is increasing by 5% per year” must not be directly written as “climate change is causing floods to increase by 5% per year”
This is a critical distinction when reading the paper.
The authors repeatedly emphasize that:
The Sentinel-1 record covers only 10 years, which is too short.
Therefore, the study can currently say:
Satellite observations show a potential increasing trend in global flood extent.
It cannot directly say:
Climate change has caused global flooding to increase by 5% per year.
Extreme floods such as those in Pakistan in 2022 can have a substantial impact on a time series that is only 10 years long.
In addition, many Sentinel-1 observations before June 2017 used only a single polarization, while dual-polarization observations became more common later. This creates another consistency issue in the observation record.
Because these factors exist, the most conservative scenario produces a trend of only 2% ± 3%, which is not statistically significant.
The authors also state clearly in the Discussion section that the observed upward trend cannot yet be causally attributed to climate change.
The most accurate conclusion is therefore:
This paper demonstrates, for the first time, the possibility of conducting observation-driven flood-trend analysis using a long-term global SAR flood database. It does not yet establish a causal link between flooding and climate change.
13. Where does the real innovation of this paper lie?
If the innovation is summarized simply as:
“Using deep learning and Sentinel-1 to map global floods,”
the paper is being undervalued.
Its real innovation is closer to the following:
It transforms a single-flood detection algorithm into a flood-observation system that can operate globally, continuously for a decade and continue to be updated.
First, the paper combines SAR change detection with lightweight MobileNet. Rather than simply identifying low-backscatter water bodies, it uses pre-flood and post-flood VV/VH changes to locate newly emerged water. This preserves the physical knowledge of SAR water-body characteristics while allowing a CNN to handle more complex spatial relationships.
Second, it separates the high-recall model from multi-source false-positive filtering. The SAR network first attempts to capture as much flooding as possible, after which land cover, elevation, soil moisture and temperature are used to address false floods caused by dry surfaces, radar shadows, permanent water bodies and freeze-thaw processes.
This solves a problem that becomes particularly serious only after entering the stage of global, 10-year cumulative mapping:
A small error rate accumulated over thousands of observations can contaminate an entire historical flood database.
Third, the paper does not produce only one global flood map. It builds a time-traceable data system. Predictions from every Sentinel-1 observation are retained, allowing the same database to generate a baseline map showing where flooding occurred at any point over the decade, study when floods occurred in a particular region and how they changed over time, and support rapid response when a new flood occurs.
Fourth, the paper treats model applicability as part of the product. The exclusion mask makes clear that steep slopes, bare ground and urban areas have higher levels of uncertainty. This design is closer to a real operational remote-sensing product than a simple effort to produce an attractive binary classification map.
Finally, and perhaps most importantly, the authors have released the model, the code and the 10-year prediction results publicly.
The paper therefore contributes more than a model that can only be viewed in an academic publication.
It delivers:
A model + 10 years of global predictions + a historical flood baseline map + open-source code.
14. Why is the dataset more likely to be the real core contribution of this Nature Communications paper than the MobileNet model?
Viewed in isolation, the network itself is not particularly complex.
The authors deliberately selected a lightweight MobileNet.
The paper does not propose a completely new Transformer architecture, introduce an especially complex attention module or emphasize algorithmic novelty by continually increasing network depth.
This means:
The core value of the paper was never really the creation of a more complex CNN.
The true challenge was:
How to make a model work across:
Different continents, terrains, seasons, land-cover types, orbits, polarization combinations and 10 years of Sentinel-1 data, while still generating a relatively consistent global product.
The authors therefore devoted substantial effort to:
- Building training samples
- Designing change features
- Preprocessing SAR data
- Filtering false positives
- Validating global generalization
- Normalizing for observation volume
- Correcting long-term trends
- Releasing the data product
This is also a valuable lesson in research strategy:
Innovation in a leading journal does not necessarily mean making the network architecture increasingly complex.
When the research question itself is important enough, extending an already viable method to a spatial scale, temporal scale and operational scale that were previously unattainable can itself constitute a strong scientific contribution.
Conclusion: This paper moves SAR flood detection from “one disaster” to “the entire globe over a decade”
The paper can be condensed into one clear chain:
Pre-flood/post-flood Sentinel-1 SAR → VV/VH change features → MobileNet flood-candidate detection → Land cover/DEM/soil moisture/temperature filtering → 10-year global flood records → Historical risk + disaster response + long-term trends.
The problem the authors are truly trying to solve is not:
“Can we detect floods?”
It is:
“Can we use a globally consistent, cloud-independent observation system to systematically reconstruct the flood history of the past decade?”
Using Sentinel-1 data from 2014 to 2024, the authors built a global SAR flood record. Compared with historical MODIS and Landsat data, the record increased the mapped global historical flood extent by approximately 71%. The model achieved an F1 score of 0.77 on the Kuro Siwo dataset covering 43 global flood events, comparable to models trained specifically on that dataset and higher than the GFM results compared in the paper.
But the most valuable lesson from the paper is not MobileNet itself.
It is the demonstration of an important research pathway:
The value of deep learning in remote sensing is not necessarily limited to raising the accuracy of single-image classification from 92% to 94%. More importantly, can a model be transformed into an observation system that operates across regions and time, updates continuously and produces genuinely new scientific data?
From this perspective, the paper’s greatest achievement is not a single global flood map. It is the establishment of a framework for:
Continuously recording global flood history with SAR.
That is why the work can connect flood mapping, disaster response, agricultural risk and global-change research within one system.
From Flood Mapping to Operational Intelligence
For organizations looking to turn satellite observations into actionable flood-risk intelligence, contact STARPATH GLOBAL to access competitively priced imagery enabled by China’s expanding satellite capacity. Its team can recommend the most suitable resolution for each industry and application, helping clients obtain data that is accurate enough for the task without paying for unnecessary detail—see the satellite imagery catalog. Organizations without prior remote-sensing experience can also apply for the Pioneer Partner Program, where the FDE team provides hands-on support while helping build in-house expertise.
Paper information
Title: Mapping global floods with 10 years of satellite radar data
Authors: Amit Misra, Kevin White, Simone Fobi Nsutezo, William Straka III and Juan Lavista
Journal: Nature Communications
Year: 2025
Volume and article number: 16:5762
DOI: 10.1038/s41467-025-60973-1
Core data: Sentinel-1 SAR