Satellite imagery can help identify what farmers are growing, even when field observations are limited. But a detailed crop map needs more than an image and a classification algorithm. It needs reference labels that match the location and growing season, observations that capture crop development, and independent checks of the results.
When those ingredients are incomplete, the practical goal is to identify crops at the level the evidence supports, retain unresolved fields, and collect additional information where it will make the greatest difference.
First, Define What You Need to Measure
Three agricultural mapping tasks are often treated as interchangeable:
- Identifying cropland: distinguishing agricultural land from other land cover, using an explicit definition that addresses temporary crops, permanent crops, grassland and fallow land.
- Identifying crop types: assigning a crop or crop group to a field for a particular growing season.
- Estimating crop area: calculating how much land a crop occupies across a defined region and reporting the uncertainty in that estimate.
A map that separates cropland from woodland does not necessarily distinguish wheat from barley. Likewise, adding up pixels labelled “wheat” produces a mapped area, but classification errors can make that total differ from the actual planted area.
Specify the reporting period as carefully as the crop classes. A field may support two crops in one year. Its physical land area and the sum of its seasonal planted areas answer different questions.
Why a Single Image or Spectral Library Is Usually Insufficient
A crop does not have one fixed spectral signature. Its reflectance changes as leaves emerge, the canopy develops, plants mature and harvest exposes the soil. Variety, moisture, soil background and viewing conditions also affect the signal. A laboratory measurement of a leaf therefore does not directly represent a satellite pixel containing leaves, shadows and exposed soil.
Different crops can look similar on one date, while the same crop can look different across fields. Spectral libraries can help investigate useful wavelengths, but they are not a substitute for reference observations matched to the sensor, location and growth stage.
A time series adds the sequence of development: green-up, canopy peak, senescence and harvest. These patterns can help distinguish crops that overlap spectrally at a single moment.
For retrospective mapping, aim to cover the full local growing season, including establishment and harvest. For an early-season product, use only observations available by the reporting date and validate that version separately. End-of-season performance does not establish early-season reliability.
Sentinel-2 optical observations and Sentinel-1 radar observations can provide complementary information. Radar helps maintain observations during cloudy periods, but its response also depends on moisture, structure and acquisition geometry. Combining the sensors still requires suitable reference data.
Check Whether Public Samples Fit Your Task
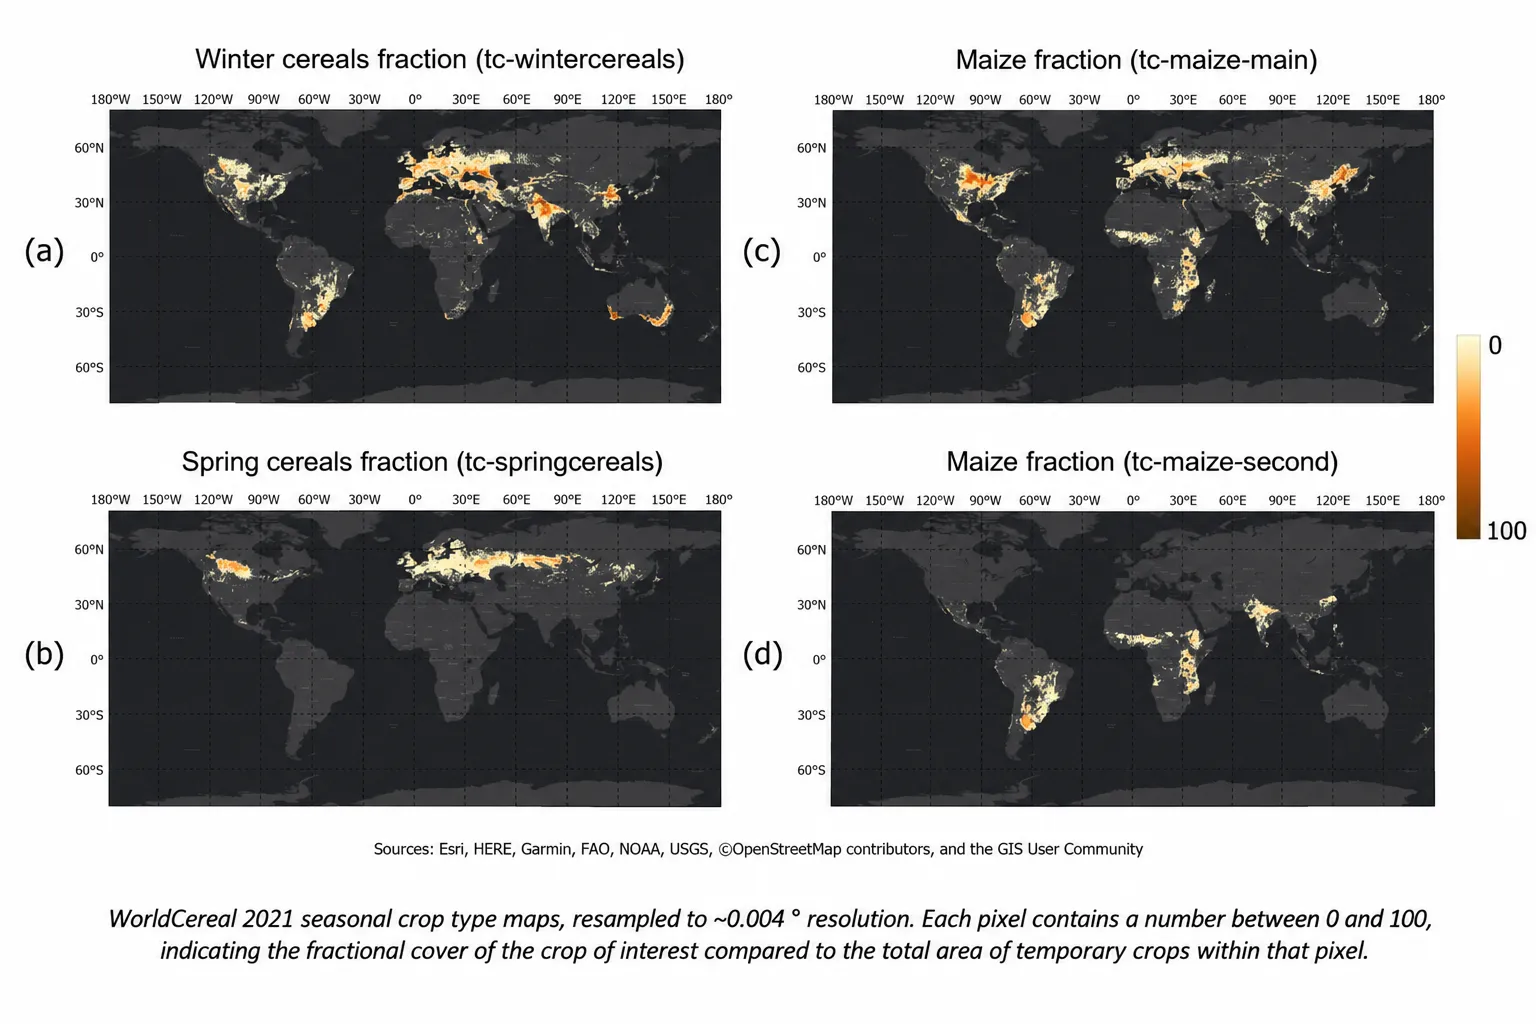
Public reference datasets can reduce the cost of collecting labels. WorldCereal’s Reference Data Module provides harmonized observations with location, time and land-cover or crop-type information. EuroCrops offers harmonized European parcel declarations. Neither should be assumed to contain suitable samples for every target region, year or class.
Before importing labels, examine the original observation method and metadata. Harmonization makes datasets easier to combine; it does not remove uncertainty in the underlying observations.
Rotation makes the temporal check essential. A field labelled wheat in a previous year may now contain barley, oilseed rape or another crop. The old label can support training when paired with the old imagery. Applying it to current imagery at the same coordinates requires new confirmation.
Similarly, an existing crop map can supply candidate training labels, but testing a new model against those same labels mainly measures agreement with the source map. It does not establish independent accuracy.
A Practical Workflow When Labels Are Scarce
1. Start with a Manageable Crop Legend
Choose classes that matter to the decision and have adequate supporting evidence. If wheat and barley cannot be separated reliably, a cereal-group output may be more useful than two poorly supported classes. Include plausible alternatives such as grassland and fallow where relevant.
2. Build and Inspect Seasonal Observations
Check field boundaries, cloud and shadow contamination, image alignment and usable observations through the season. Examine individual field trajectories before selecting features. Record gaps around important stages rather than assuming that interpolation recovers the missing evidence.
For small fields, inspect how much of each pixel falls outside the parcel. Field-interior summaries can reduce boundary mixing, but narrow or fragmented parcels may still need finer imagery.
3. Assemble a Small, Documented Local Reference Set
Combine suitable public observations with available planting records, farmer confirmations or targeted surveys. Record each label’s field, season, source and confidence. Dated high-resolution imagery can help check boundaries and visible characteristics, but may not establish the species of similar cereals.
4. Train a Baseline and Test Transfer Explicitly
A conventional classifier using seasonal features provides a useful starting point. Pretrained representations and few-shot methods may reduce the demand for local training labels; research such as EuroCropsML explores this approach. Their performance still needs testing in the intended region and season.
Keep all observations from the same field together when separating training and evaluation data. Randomly splitting neighbouring pixels can place nearly identical information on both sides of the split and exaggerate performance.
5. Direct New Labelling Toward Important Gaps
Review uncertain predictions, disagreements and poorly represented crops. These fields can guide additional training-data collection. Keep this targeted collection separate from the independent sample used to assess final accuracy and regional area.
Keep “Unknown” as a Valid Outcome
A classifier trained only on wheat, barley and maize may assign an unfamiliar crop to one of those classes. Even a high model score does not prove that the field belongs to a supported class.
A practical reporting policy should consider both model output and evidence quality. The following is an illustrative decision example, not a measured project result:
- Supported crop label: local reference evidence and sufficient seasonal observations support the distinction.
- Broader crop group: cereal cover is supported, but wheat and barley remain unresolved.
- Unknown crop type: the field is agricultural, but its crop is unsupported or ambiguous.
- Insufficient observations: missing imagery prevents a defensible crop decision.
Store the reason for withholding a detailed label. Acceptance rules should be selected using development data and assessed on independent samples; there is no universal confidence threshold that guarantees correctness.
Validate Crop Labels and Area Estimates Separately
Use independent, season-matched reference observations to report a confusion matrix and performance for each crop. Producer’s accuracy describes how many reference examples of a crop were detected; omission error describes those missed. User’s accuracy describes how many predictions of a crop were correct; commission error describes incorrect assignments to that crop.
Include sample counts and uncertainty. An overall accuracy score can conceal poor performance for a less common crop. Also report the proportion of fields or area left unresolved, so accuracy among accepted predictions is not mistaken for accuracy across the whole region.
Regional area estimates require a suitable probability sampling design and analysis that respects the sampling weights. Use the reference sample to account for classification error and calculate confidence intervals. Convenient training samples alone cannot support that inference.
Distinguish mapped area from statistically estimated area, and retain unresolved land in the accounting. Where independent evidence is insufficient, publish provisional mapped totals with explicit limitations rather than presenting them as validated crop statistics.
Turn the Map into a Reviewable Agricultural Product
A useful delivery includes crop labels by field and season, observation coverage, unresolved fields, reference-data provenance, validation results and clearly defined area totals. This lets users see which conclusions are supported and where additional checks are needed.
For agricultural teams planning crop mapping, STARPATH GLOBAL combines satellite resources, data processing and AI interpretation around the intended decision. By discussing your target region, crop classes, reporting season and available field records with STARPATH GLOBAL, you can define an imagery and validation approach that matches the task, including where finer imagery or additional local observations would add value.