
The Chamoli slope did not suddenly fail on 7 February: Satellite data reveal a decade of progressive deterioration before the rockslide.
At a glance: The Chamoli disaster of 7 February 2021 appeared to be a sudden rock–ice avalanche in the high mountains. This paper, however, focuses not on how far the post-failure flood traveled, but on what had been happening to the slope over the preceding years and even decades. Using multiple data sources—including Sentinel-2, Landsat, Planet, an ALOS digital elevation model, AMSR2 microwave brightness temperatures, and ERA5 temperatures—the authors reconstructed a chain of events: long-term warming and changes in freeze–thaw conditions → gradual loss of snow and ice cover → reduced lateral support following a nearby ice avalanche in 2016 → continued expansion of cracks at the top of the slope after 2017 → a sharp reduction in ice cover, greater meltwater infiltration, and intensified frost heave in 2020 → sudden crack coalescence on 5 February 2021 → snowfall and a dramatic cooling–warming cycle during the final 24 hours, which together pushed an already critically balanced slope past the point of failure.
At 10:21 a.m. India Standard Time on 7 February 2021, a massive rock–ice avalanche occurred in the Chamoli district of Uttarakhand, India.
Much of the post-disaster research initially focused on several questions:
How large was the failed mass? How fast did it move? Why did it transform into a debris flow? And why was the damage downstream so severe?
This paper takes a different approach.
The question the authors really wanted to answer was:
Did such a massive slope truly “break” all at once on 7 February?
Or had satellites already recorded a series of slow but persistent signs of instability years earlier?
This is the essence of “progressive destabilization” in the paper’s title:
The disaster happened in an instant, but the slope may have been preparing to fail for many years.
1. What sets this study apart from a conventional post-disaster causal analysis?
Dense monitoring networks are difficult to install in high-altitude mountain regions.
The Chamoli source area lies above 5,000 meters, with steep terrain and substantial snow and ice cover. Before the disaster, virtually no continuous field monitoring had been conducted on this particular slope.
The authors therefore did not focus on a one-off reconstruction after the event. Instead, they traced the slope’s evolution as far back in time as possible.
Using more than a decade of multisource satellite and reanalysis data, they looked for four main types of change:
- Did the surface temperature exhibit any long-term anomalies?
- Did snow and ice cover continue to retreat?
- Had disturbances occurred on nearby slopes?
- Did cracks in the rock mass develop progressively before the disaster?
They then used three-dimensional geometry and mechanical modeling to answer another question:
How did these long-term changes progressively reduce resisting forces and ultimately bring the slope to a critical state?
The study’s central aim was therefore not to prove that any single factor triggered the disaster. It was to construct a complete failure sequence:
Long-term background conditions → medium-term weakening → pre-failure acceleration → final triggering
2. Why was the source area inherently hazardous?
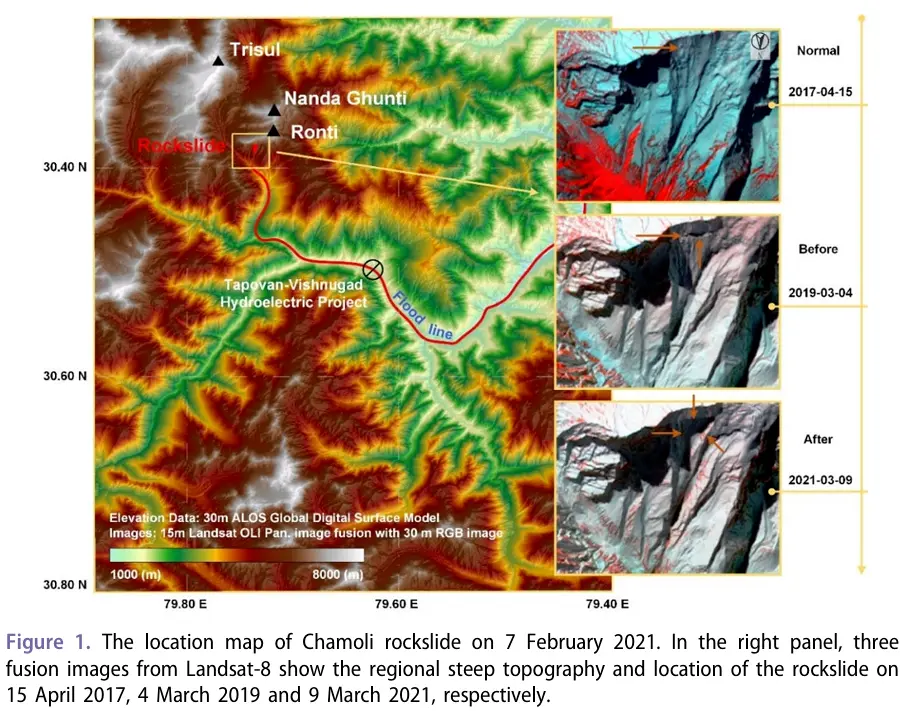
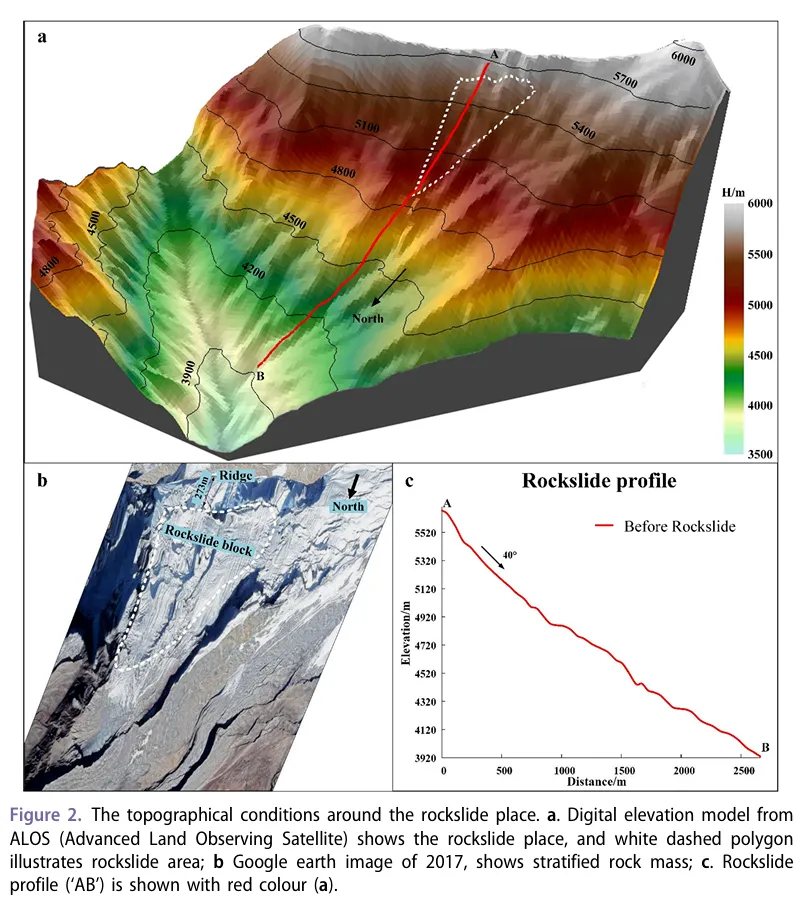
The rockslide source area is located on a north-facing slope in the High Himalayas. The rock mass consists of metamorphic rock with well-developed layering and joints.
Several topographic conditions highlighted in the paper are particularly important.
The failed mass was located at an elevation of approximately:
5,600 meters.
Before the collapse, the slope angle was approximately:
40°.
Citing earlier studies, the authors note that an angle of around 37° is already close to the critical inclination for this type of high-mountain rock slope. The site was therefore an extremely steep, high-potential-energy slope even before the disaster.
The bergschrund at the top—the large crevasse between the snow- and ice-covered area and the rock wall—was only about 273 meters from the ridge.
The slope also displayed pronounced layered and stepped structures formed by glacial erosion and unloading.
In other words, the slope was not a single, intact, uniform, and solid block of rock.
A more accurate description would be:
A steep, thin, heavily jointed rock mass at high elevation that had long been affected by glacial and permafrost processes.
These conditions provided the geological setting for subsequent freeze–thaw activity, crack propagation, and the loss of lateral support.
3. Why did the authors use AMSR2 microwave brightness temperatures to study temperature change?
Rather than using high-resolution land-surface-temperature imagery to construct a decade-long time series, the paper used horizontally polarized AMSR2 microwave brightness-temperature data at 89 GHz.
AMSR2 has a spatial resolution of approximately:
5 kilometers.
That is far larger than the actual failed mass, so the authors were not attempting to measure the temperature of an individual crack in detail.
Their reasoning was as follows:
If surface composition and moisture conditions do not change substantially within the same month, long-term variations in microwave brightness temperature can, to some extent, reflect changes in surface temperature.
The authors selected:
- a rock pixel;
- a vegetation pixel;
- a key pixel covering the rockslide area;
and compared monthly mean microwave brightness temperatures for January and February from 2013 to 2021.
The results showed pronounced high–low fluctuations across the study area from 2018 to 2021. The authors interpreted these as evidence that the source area had experienced strong:
freezing–thawing–refreezing processes.
They regarded this as one of the important long-term factors weakening the slope.
One caveat is essential, however:
AMSR2 brightness temperature is not the same as a direct measurement of rock temperature.
It is also affected by surface emissivity, moisture content, and land-cover type.
The authors therefore used Landsat and Sentinel-2 data to examine changes in the proportions of rock, snow and ice, and vegetation. This was intended to minimize the possibility that variations in brightness temperature merely reflected changes in surface type.
4. What did ERA5 reveal? Repeated freeze–thaw cycles before the disaster are the key signal
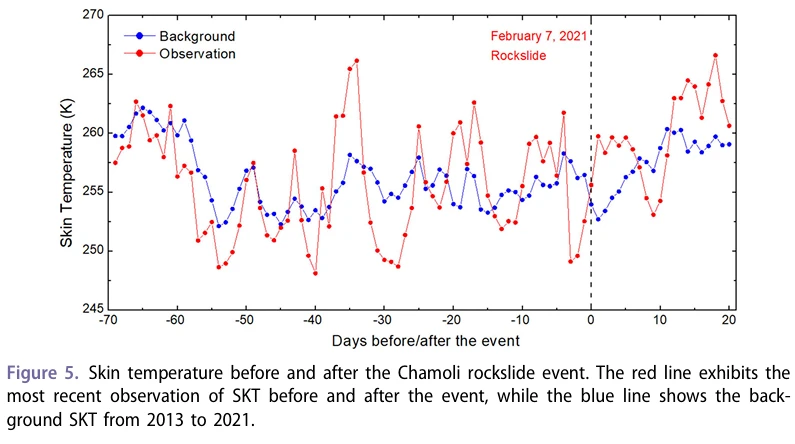
The authors also used ERA5 skin-temperature data to analyze temperature variations during the approximately 70 days preceding the disaster.
The results showed that:
During the background period, the temperature fluctuated by only about:
5 K.
During the 70 days before the disaster, however, the fluctuation reached:
approximately 10 K.
The authors believe this indicates that the area may have experienced more frequent and intense freeze–thaw cycles in the weeks before the collapse.
Most notably, during the final five days, temperatures showed a clear pattern of:
decline → rapid rebound.
The paper explains that the cold phase would have caused water already present in joints and cracks to continue freezing, intensifying:
ice segregation and frost heave.
The subsequent warming would then have reduced:
- ice–rock bonding strength;
- the shear strength of the ice.
In other words, the interior of the slope may first have been forced farther apart by freezing and then softened by warming.
For a fractured rock mass already close to limiting equilibrium, such rapid thermal changes can be highly dangerous.
5. Changes in snow and ice cover provide the study’s most important long-term evidence
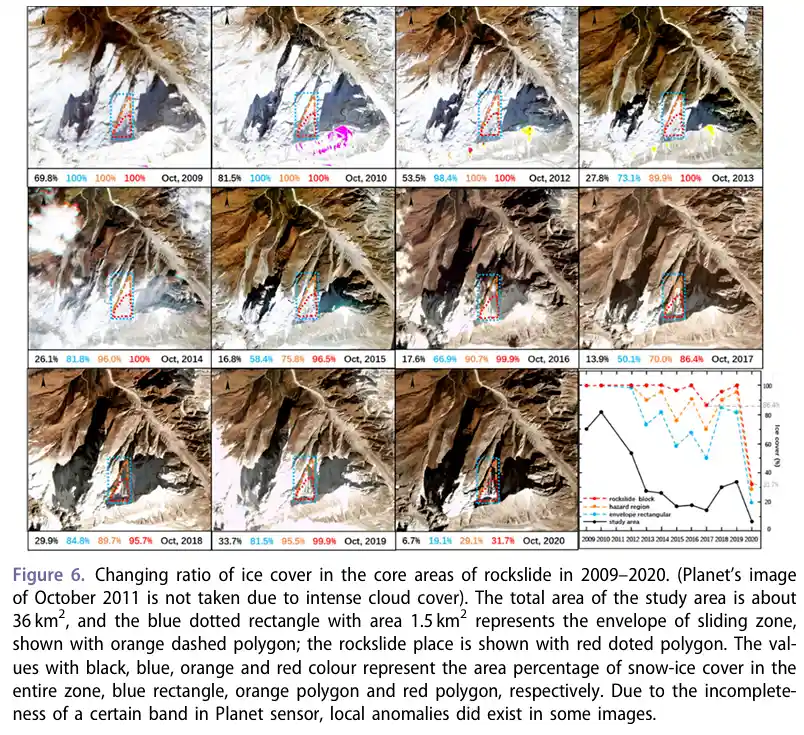
The paper used relatively snow-free and cloud-free autumn imagery from 2009 to 2020 to track snow and ice cover in the source area.
Across the approximately 36-square-kilometer study area, the proportion covered by snow and ice changed dramatically:
- approximately 81.5% in 2010;
- approximately 13.9% in 2017;
- approximately 33.7% in 2019;
- a new low of approximately 6.7% in 2020.
This was not a simple, monotonic decline.
Instead, the pattern was:
decline → recovery → another sharp decline.
The authors believe these cyclical changes reflect pronounced fluctuations in freeze–thaw activity and the region’s thermal conditions.
The failed mass itself also underwent substantial change.
In 2017, approximately:
13.6% of its surface was already exposed.
In other words, snow and ice still covered about 86.4% of the failed mass at that time.
By 2020:
only 31.7% remained covered by snow and ice.
This means that about 68.3% of the rock surface had become exposed.
The authors regard this as a critical change.
The retreat of ice cover does not simply mean that “more rock becomes visible.” It also means that a rock mass previously sheltered and supported by snow and ice is exposed to more:
- solar radiation;
- meltwater infiltration;
- freeze–thaw cycling;
- thermal disturbance.
6. Why was the nearby ice avalanche in 2016 so important?
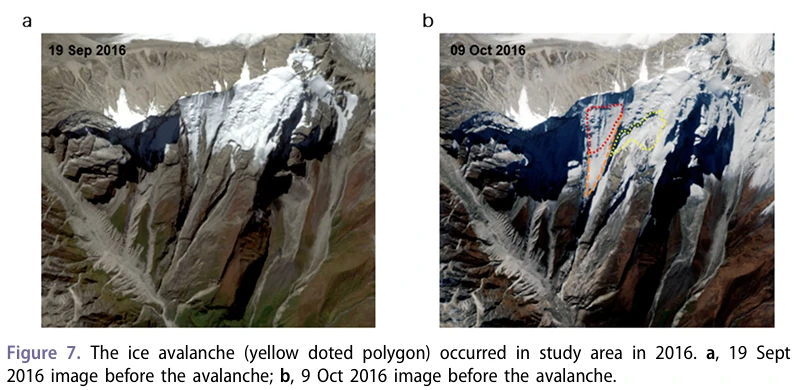
Sentinel-2 images acquired on 19 September and 9 October 2016 revealed an ice avalanche immediately west of the source area.
Although this event did not directly trigger the main rockslide in 2021, it may have altered the slope’s boundary conditions.
The authors identify three main effects.
First, the western rock wall, previously covered or supported by ice, became exposed.
Second, the exposed rock wall was subjected to more solar radiation and temperature variation.
Third, the loss of ice caused:
glacial debuttressing, or a reduction in lateral support.
Put simply:
The ice that had pressed against the mountainside and helped support it gradually disappeared.
At the same time, the nearby ice avalanche and unloading may have disturbed the local stress field, allowing existing joints and cracks to propagate more easily.
The year 2016 can therefore be understood as a turning point:
the moment when the slope’s long-term stability was clearly disrupted.
7. The most alarming evidence: Cracks were already visible from space in 2017
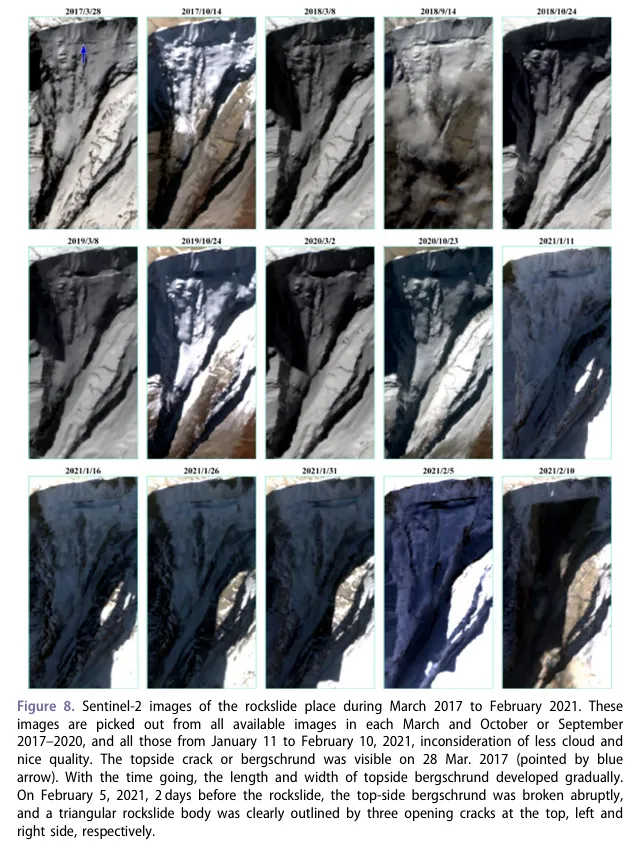
The authors compiled a series of Sentinel-2 images acquired between March 2017 and February 2021.
On 28 March 2017:
a crack or bergschrund at the top of the slope was already visible.
Over the following years, the crack gradually increased in:
- length;
- width;
- visibility.
By 24 October 2018, the paper reports that a horizontal crack approximately:
50 meters wide
had become clearly visible.
After 2020, cracks along the top and sides continued to develop.
This means that:
7 February 2021 was not the first time the slope suffered structural damage.
At least four years earlier, satellites had already detected a progressively forming upper detachment boundary.
From a hazard-monitoring perspective, this finding is more important than a post-event volume estimate.
It shows that some high-mountain rockslides may display geometric precursors that can be identified in long-term optical satellite time series before failure.
8. What happened on 5 February 2021? The signal closest to the critical point
The authors did not examine only year-to-year imagery. They also compiled every low-cloud, high-quality Sentinel-2 image acquired between 11 January and 10 February 2021.
The most important date was:
5 February 2021.
That was two days before the disaster.
The paper found that:
the upper bergschrund ruptured markedly, while new top-corner cracks formed on both the eastern and western sides.
Once these three open cracks connected, the outline of a triangular potential sliding mass became clearly visible.
The authors therefore concluded that:
by 5 February, the slope had entered a state of critical instability.
This was fundamentally different from the slow crack development observed in earlier years.
The period from 2017 to 2020 represented:
long-term structural weakening.
The changes on 5 February represented:
the coalescence of the failure boundary.
Once the top, sides, and potential basal rupture surface of the sliding mass had become progressively connected, the question was no longer whether the slope would continue to weaken, but:
when an additional disturbance would finally send it downslope.
9. Why is the three-dimensional model important? It turns visible cracks into a mechanical explanation
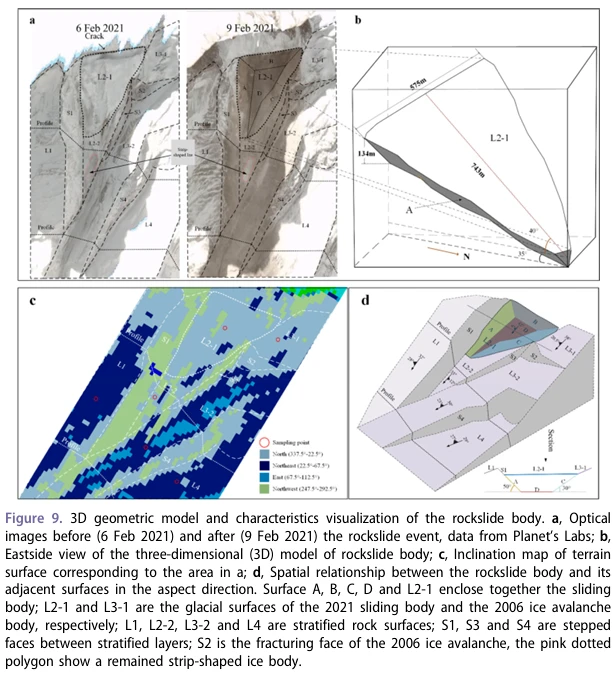
The authors reconstructed the geometry of the failed mass using:
- Sentinel-2;
- Planet;
- an ALOS 30-meter digital elevation model;
- pre- and post-disaster imagery;
- previous aerial surveys.
They simplified the rock mass as:
an irregular hexahedron.
Its volume was estimated at:
18.797 million cubic meters.
This figure should be understood as an estimate derived from the geometric boundaries and thickness assumptions adopted in this study.
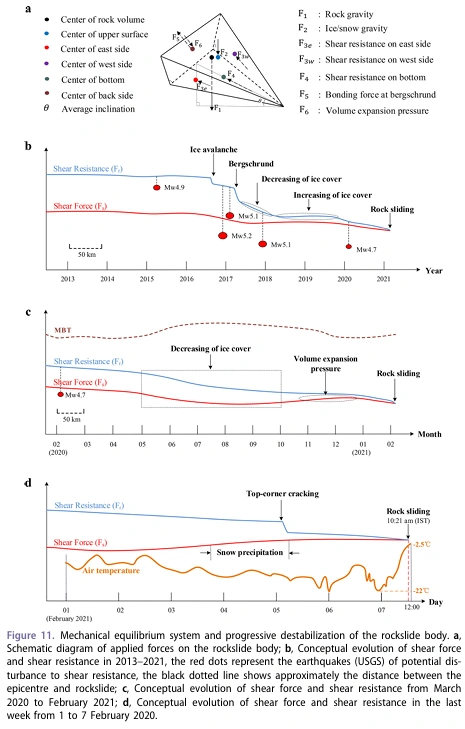
The authors then divided the forces acting on the sliding mass into:
driving forces
and:
resisting forces.
In simple terms:
Whether the rock mass can remain on the slope depends on whether the forces pulling it downward exceed those holding it in place.
The paper defines the factor of stability as:
f = resisting force / driving force.
When:
f > 1,
the slope can generally remain stable.
When long-term weakening and short-term triggers gradually push f toward 1, the slope enters an extremely dangerous state.
10. What does the study’s “progressive destabilization chain” look like?
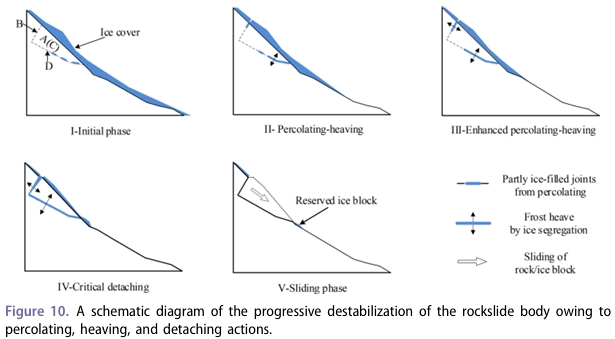
When all the evidence is assembled, the authors propose the following sequence.
Stage 1: Long-term changes in the thermal environment
Long-term surface-temperature fluctuations and warming promoted the melting of snow and ice and the degradation of permafrost.
Stage 2: Snow and ice retreat, allowing meltwater to enter fractures
As more rock surfaces became exposed, meltwater could penetrate joints, the upper crack, and the potential sliding surface.
Stage 3: The nearby ice avalanche in 2016 reduced lateral support
The loss of ice on the western side and the resulting stress release made the slope boundary less stable.
Stage 4: Cracks continued to expand after 2017
Water entering the fractures repeatedly froze. Ice segregation and frost heave then drove further crack propagation.
Stage 5: Ice cover declined sharply in 2020
Large areas of rock became exposed, intensifying hydrothermal effects while lateral support continued to weaken.
Stage 6: Cracks coalesced on 5 February 2021
Cracks at the top and on both sides together outlined the complete potential sliding mass.
Stage 7: Snowfall and extreme temperature changes during the final days
Fresh snow increased the downslope load. Water freezing within fractures intensified frost heave, while the subsequent warming weakened ice bonding and shear strength.
Ultimately:
driving forces continued to increase, resisting forces continued to decline, and the stability factor approached 1.
On the morning of 7 February, the rock mass failed as a whole.
11. Why were the final 24 hours especially dangerous?
Figure 11d in the paper places the temperature changes during the final week alongside the conceptual mechanical processes.
The authors argue that the final 24 hours saw a pronounced temperature reversal:
first falling from approximately:
−10°C to about −22°C,
and then rapidly rising to around:
−2.5°C.
The initial sharp cooling favored continued freezing and frost heave of water within the fractures.
The subsequent rapid warming may then have substantially reduced the ice’s:
- bonding strength;
- shear strength.
Meanwhile, snowfall persisted from 2 to 6 February, and the cracks along the top and sides developed rapidly on 5 February.
The paper therefore describes the slope, just hours before the disaster, as being in a state in which:
nearly every major factor was shifting toward instability at the same time.
This distinction between “long-term drivers” and “final triggers” is crucial.
Long-term warming alone cannot explain why the collapse occurred at precisely 10:21 a.m. on 7 February.
The timing was more likely determined by:
a severely weakened slope + coalescence of critical cracks + snowfall + dramatic temperature changes during the final 24 hours.
12. What is genuinely innovative about this paper?
The greatest value of this study does not lie in proposing a new landslide-detection algorithm.
Its real contribution is that it connects the events through time.
First, it moves beyond post-disaster interpretation to reconstruct long-term pre-failure evolution.
Rather than examining only the period around 7 February, the authors placed changes in snow and ice since 2009, temperature variations since 2013, and crack development since 2017 on the same timeline.
Second, it links different remote-sensing sources to different physical processes.
- Microwave brightness temperature: long-term thermal conditions;
- ERA5: pre-disaster temperature fluctuations;
- Landsat, Sentinel-2, and Planet: snow, ice, and cracks;
- DEM: slope, aspect, and three-dimensional geometry;
- Historical imagery: the nearby ice avalanche and changes in lateral support.
This is not simply a stack of multisource datasets. Each dataset is used to explain a specific process.
Third, it connects remote-sensing observations with rock-mass mechanics.
The loss of ice cover, crack expansion, and meltwater infiltration are not left as visual interpretations. They are incorporated into a mechanical framework of:
driving forces versus resisting forces.
Fourth, it emphasizes progressive destabilization.
The paper’s most important conclusion is that the final failure resulted from years of cumulative weakening, while short-term weather pushed an already critical slope across the final threshold.
13. Which conclusions should be interpreted cautiously?
The paper presents a comprehensive mechanism chain, but this does not mean that every link was directly measured and proven.
First, AMSR2 has a spatial resolution of approximately 5 kilometers.
The actual rockslide source area is far smaller than a single AMSR2 pixel.
Microwave brightness temperature therefore reflects regional-scale thermal conditions rather than the temperature of a specific crack or potential sliding surface.
Second, inferring land-surface-temperature changes from brightness-temperature variations requires assumptions.
The authors assumed that surface composition and moisture conditions varied only modestly within the same month and used optical imagery for supplementary validation.
Even so, microwave brightness temperature remains sensitive to emissivity, moisture content, and surface composition.
Third, permafrost degradation is inferred mainly from remote sensing and the thermal environment.
No pre-disaster borehole temperatures, subsurface ice-content measurements, or internal rock-temperature observations were available. “Permafrost degradation” is therefore a physically plausible mechanism rather than a process directly measured in the field.
Fourth, frost heave, pore water, and ice segregation were not directly observed.
The proposed sequence—meltwater infiltration, refreezing, and crack propagation driven by ice segregation—is an interpretation constructed from temperature, snow and ice, crack observations, and earlier research on rock–ice mechanics.
Fifth, the three-dimensional model is substantially simplified.
The failed mass was approximated as an irregular hexahedron. Some side geometry was inferred from adjacent slopes, while thickness was based on earlier aerial surveys.
The estimated volume of 18.797 million cubic meters should therefore be treated as a model-derived estimate, not a point-by-point field measurement.
Sixth, climate change should not be described simply as having “directly triggered” this individual rockslide.
The paper itself notes that attributing a single event to climate change remains difficult.
A more accurate formulation is:
Regional warming and cryospheric change created an unfavorable long-term background, while the cracks, snowfall, and rapid temperature changes in February 2021 were more closely associated with the final triggering conditions.
Conclusion: What matters is not only whether a slope is moving, but whether it is progressively losing the conditions that keep it stable
The most important takeaway from this paper is not any single temperature measurement or crack.
It is the chronology reconstructed by the authors:
- Snow and ice began retreating markedly around 2010;
- A nearby ice avalanche disturbed the slope and reduced lateral support in 2016;
- A crack at the top was already visible in 2017;
- Freeze–thaw activity and ice segregation continued in 2018 and 2019;
- By 2020, about 68.3% of the failed mass’s surface was exposed;
- On 5 February 2021, cracks at the top and sides rapidly coalesced;
- Snowfall and an extreme cooling–warming cycle during the final 24 hours then helped drive the slope to complete failure.
Chamoli was therefore not a typical case of:
“It suddenly became warmer one day, so the mountain collapsed.”
It was more like this:
Years of thermal, hydrological, and structural deterioration gradually pushed the slope from relative stability toward a critical state, before weather and crack development over the final days and hours triggered the collapse.
This is highly significant for monitoring hazards in high-mountain regions.
Meaningful early warning should not wait until a landslide is already accelerating rapidly.
Instead, monitoring should identify in advance:
- anomalous snow and ice retreat;
- nearby ice avalanches or the loss of buttressing;
- intensifying freeze–thaw cycles;
- persistent crack expansion;
- sudden pre-failure crack coalescence;
- extreme snowfall and rapid temperature changes.
Only by placing these signals on the same timeline can hazard assessment truly move from post-disaster explanation to pre-disaster detection.
For governments, research teams, and risk-management organizations seeking to turn multitemporal satellite observations into operational mountain-hazard monitoring, China’s expanding satellite capacity is making high-quality imagery more accessible and cost-effective worldwide. STARPATH GLOBAL helps clients select the right balance of resolution, revisit frequency, coverage, and cost through its satellite imagery catalog; organizations can also contact our team to discuss tailored data access and monitoring requirements. Those without in-house remote-sensing expertise can apply to the Pioneer Partner Program for project support and personnel training from our FDE team.
Paper Information
Title: Progressive destabilization and triggering mechanism analysis using multiple data for Chamoli rockslide of 7 February 2021
Authors: Wenfei Mao, Lixin Wu, Ramesh P. Singh, Yuan Qi, Busheng Xie, Yingjia Liu, Yifan Ding, Zilong Zhou, and Jia Li
Journal: Geomatics, Natural Hazards and Risk
Volume, issue, and pages: 13(1), 35–53
Year: 2022
Published online: 21 December 2021
DOI: 10.1080/19475705.2021.2013960
Event time: 04:51 UTC / 10:21 IST on 7 February 2021
Core datasets: Sentinel-2, Landsat, Planet, ALOS DEM, AMSR2, and ERA5
Core themes: Long-term warming, snow and ice retreat, freeze–thaw activity, nearby ice avalanche, crack development, three-dimensional geometric modeling, mechanical instability, and final triggering