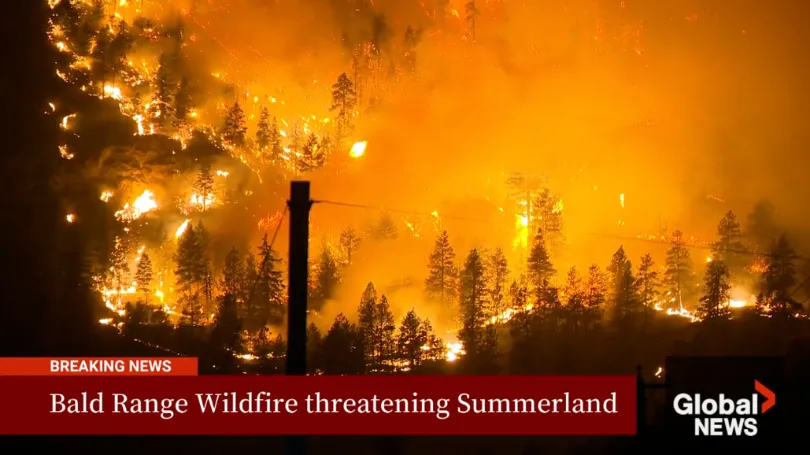
The Bald Range wildfire in British Columbia’s Southern Interior was first reported on the evening of August 7, 2026. According to local emergency officials, it grew to approximately 50 square kilometres within about three hours. By the afternoon of August 8, it had burned more than 100 square kilometres and advanced roughly 15 kilometres toward Okanagan Lake. Reuters subsequently reported that the fire had exceeded 103 square kilometres by the night of August 8, while updated BC Wildfire Service perimeter mapping on August 9 placed it at approximately 136 square kilometres—an increase of roughly one-third overnight.
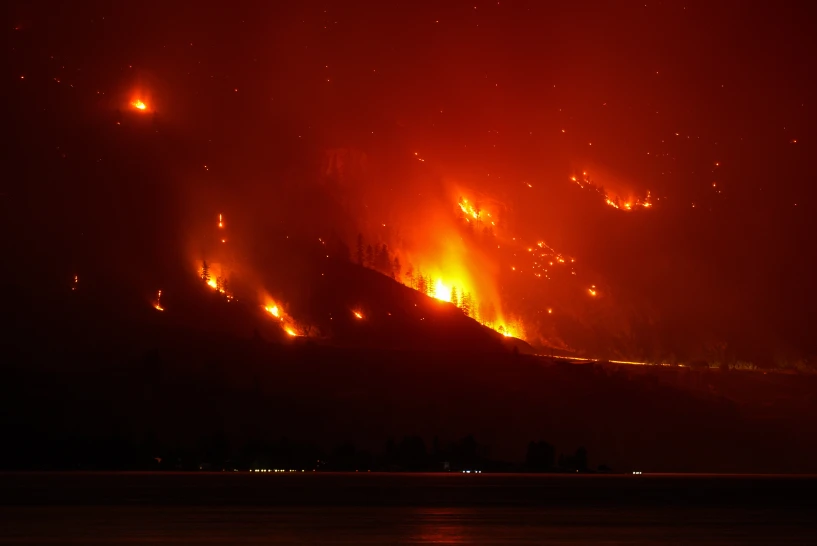
The Bald Range wildfire, which has forced people out of their homes in the south Okanagan region, burns in Summerland, B.C., late Saturday, Aug. 8, 2026. (Darryl Dyck/The Canadian Press via AP)
As the fire approached nearby communities, all 12,000 residents of Summerland were ordered to evacuate, along with approximately 8,000 people in and around Peachland. Police went door to door in the early hours of the morning, and some residents had time to take only their pets and essential documents. A limited number of evacuation routes quickly became congested, sections of highway were closed, and heavy smoke further reduced visibility. More than 50 people trapped by the fire had to be rescued by aircraft.

Greg Krauter, who was forced to evacuate his Summerland property with his seven goats in the middle of the night due to the Bald Range wildfire, checks on some of them in the back of his truck as others walk around outside an evacuee center, in Penticton, British Columbia, on Saturday, Aug. 8, 2026. (Darryl Dyck/The Canadian Press via AP)
In response to the rapidly escalating fire activity and mass evacuations, British Columbia declared a province-wide state of emergency on August 8.At its most intense, the Bald Range fire generated powerful convection and lightning, conditions described by provincial officials as a “remarkable escalation in fire activity.”
What made the event especially significant was not only its size, but the speed at which conditions changed. A recently mapped perimeter could quickly become outdated, while road access, community exposure and the time available for evacuation could change within a single reporting cycle.
The central challenge was therefore not simply determining how large the fire had become. It was maintaining a reliable operational picture while conditions on the ground were changing faster than information could be collected, integrated and delivered to decision-makers.
The real challenge is not data scarcity. It is observation-to-action latency.Explore how satellite data supports environmental and disaster monitoring →
Rapid Wildfire Growth: Causes and Decision-Making Challenges
The cause of the Bald Range wildfire remains under investigation. However, available information indicates that several environmental conditions supported its rapid growth:
- Low snowpack and prolonged dryness reduced available moisture. Parts of British Columbia’s Southern Interior had experienced below-normal snowpack, persistent drought and above-average temperatures. Earlier snowmelt and limited rainfall can cause soils, forest-floor material and woody fuels to dry sooner, leaving the landscape more receptive to ignition and sustained burning.
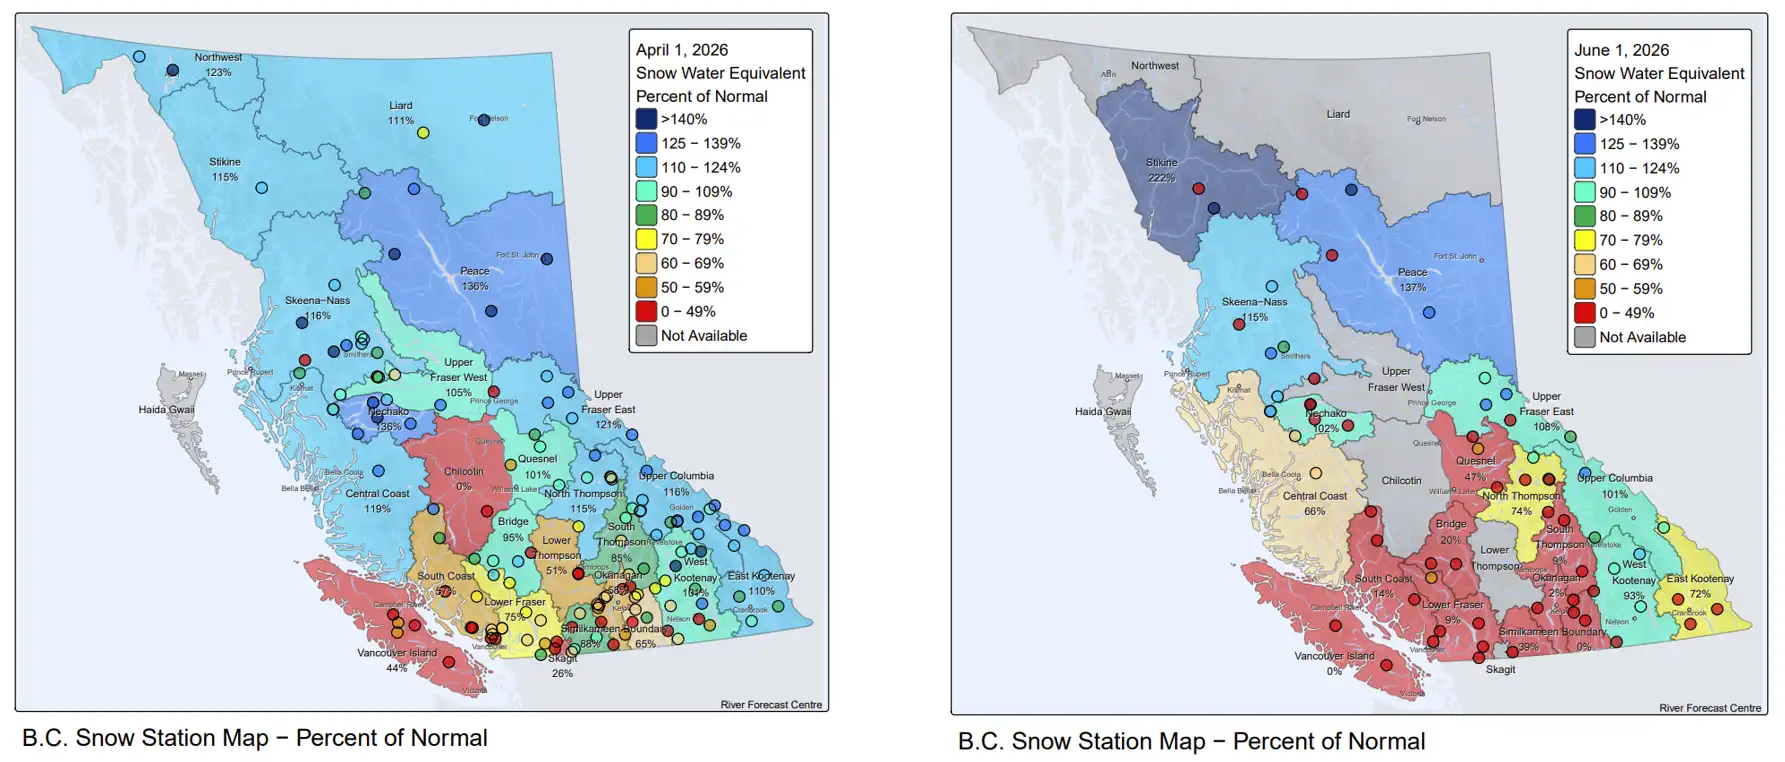
Below-normal snowpack was observed across parts of British Columbia’s Southern Interior ahead of the core 2026 wildfire season. Snow water as a percentage of normal in April (left) and June (right). Source: BC Wildfire Service.
- Dry vegetation provided continuous fuel. Grass, pine needles, shrubs and woody material were highly receptive to ignition, allowing fire to spread quickly across the landscape.
- The night brought limited relief. BC Wildfire Service updates indicated poor overnight humidity recovery, with relative humidity at approximately 33 percent, allowing fine fuels to remain relatively dry after dark.
- Wind and terrain amplified fire behaviour. Wind could carry embers beyond the main fire front, while Okanagan’s hills and valleys could channel local winds and accelerate uphill spread.
- Spotting created sudden changes. Embers landing ahead of the main perimeter could ignite new fires across roads or control lines, causing growth to occur in leaps rather than along a predictable front.
These conditions explain why the fire could expand rapidly. The operational danger, however, came from how quickly that growth changed the information available to emergency teams:
- Fire information aged quickly. A recently produced perimeter could become outdated before it was distributed and incorporated into operational decisions.
- Evacuation windows contracted. Roads considered usable during one reporting cycle could later be affected by smoke, congestion, closures or changing fire conditions.
- Resources had to be repositioned continually. Firefighters, police, utilities, transportation agencies and local governments needed to coordinate while the location and direction of the threat continued to change.
The Bald Range wildfire therefore exposed a common emergency-response speed gap: the hazard may evolve faster than information can be collected, integrated, interpreted, and converted into action.
Closing that gap requires more timely awareness of fire activity and a consistent regional picture shared across organizations. Yet during a fast-moving wildfire, no single observation method can independently provide the complete view.
Traditional Observation Methods Are Essential—but Limited in Coverage and Integration
Ground crews, weather stations, aerial reconnaissance, drones, and reports from local residents remain indispensable components of wildfire response.
Ground teams can directly observe fire behaviour. Drones can provide high-resolution imagery of specific areas. Weather stations continuously record temperature, humidity, and wind conditions. Aircraft can support reconnaissance, suppression, and rescue operations.
The challenge is that each source usually provides only part of the operational picture.
Ground teams cannot safely enter every area. Drones are limited by coverage, endurance, weather, and flight restrictions. Aerial reconnaissance may be affected by smoke, weather conditions, and airspace coordination. Weather stations provide measurements at inpidual locations rather than a complete view of the fire. Data from different organizations may also vary in format, spatial resolution, and update frequency.
Emergency teams need to understand the locations of new hotspots, changes in the fire perimeter, the effects of wind and humidity on fire behaviour, and which communities, roads, and critical infrastructure are entering potential impact zones. The problem is not a complete lack of data. It is that the necessary information is often distributed across separate systems.
If these datasets must be manually downloaded, converted, mapped, and passed through multiple organizational layers, the fire may have entered its next phase by the time the integrated information reaches decision-makers.
How Can Satellites Help Close the Wildfire Speed Gap?
When fire growth may occur in sudden leaps rather than through a steady, uniform advance, satellite remote sensing cannot replace incident command or independently determine evacuation routes. It can, however, complement ground-based information at a regional scale, helping organizations detect change, understand potential impacts, and prioritize further monitoring.
Multi-Source Satellite Data Can Track Fire Changes
Satellite thermal-infrared data can identify heat anomalies and active fire detections across large areas, complementing ground patrols in regions that cannot be monitored continuously. Combining data from satellites with different revisit schedules can reduce the time between the appearance of a new fire and its inclusion in a regional situational assessment. For spot fires located away from the primary fire front, more timely wide-area observation can support faster verification and response.
When atmospheric and imaging conditions permit, high-resolution optical imagery can provide information on the surface condition of roads, communities, vegetation, and infrastructure, making it useful for assessing the spatial relationship between the fire and specific assets.
Synthetic aperture radar, or SAR, provides an additional source of information at night and under cloud cover, as well as when smoke limits optical observation. It can also support post-disaster analysis by identifying significant changes to the ground surface and built environment.
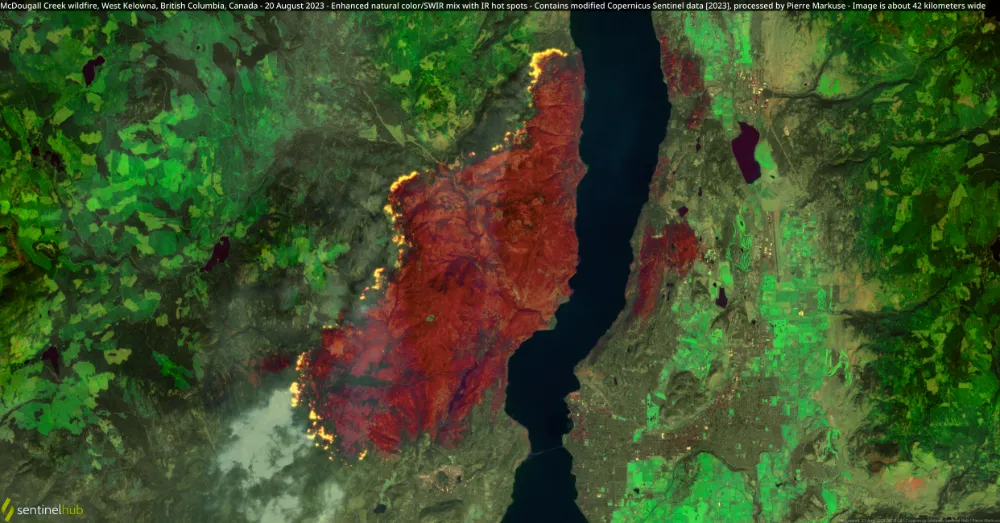
A Copernicus Sentinel view of the 2023 McDougall Creek wildfire near Okanagan Lake, illustrating how infrared-enhanced satellite imagery can reveal active fire fronts, smoke, and burned areas. Copernicus Sentinel-2 image, processed by Pierre Markuse (CC BY 2.0).
The rapid succession of perimeter estimates—from approximately 103 square kilometres on the night of August 8 to about 136 square kilometres on August 9—demonstrates why one-time or low-frequency mapping may struggle to represent a rapidly changing fire. By combining the revisit capabilities of different satellites with weather observations and ground information, analysts can reduce observation gaps and identify new heat anomalies, perimeter changes, and evolving spatial relationships between the fire, communities, and infrastructure.
For a fire such as Bald Range, the value of multi-temporal observation is not simply that it shows the fire. It helps determine where change is occurring. Explore satellite data capabilities →
Turning “Where Is the Fire?” Into “What Is at Risk?”
A fire perimeter alone is not enough to support a complete emergency response.
When regularly updated perimeter data, hotspot locations, and asset information can be integrated into emergency-command or GIS systems, they can provide more timely regional context for risk assessment, resource deployment, and evacuation planning.
By overlaying fire information with roads, communities, population data, power grids, telecommunications networks, water resources, hospitals, industrial facilities, and other critical assets, organizations can begin to answer more operationally relevant questions:
- Which communities are approaching potential impact zones?
- Which roads are most likely to be affected first?
- Which critical facilities have no alternative access routes?
- Which areas require more frequent monitoring?
- Which assets should be prioritized for post-disaster inspection?
This process turns satellite observation into exposure analysis. It moves the question from what has happened to what requires attention next.
Building a Continuous View Before, During, and After a Wildfire
The value of satellite data is not limited to the period when a wildfire is actively burning.
Before a fire, historical imagery and data on vegetation, terrain, and asset locations can support risk screening. During the event, satellite observations can help update fire changes and asset exposure. Afterward, imagery can support burned-area mapping, preliminary detection of changes to buildings and infrastructure, and the prioritization of field inspections by insurers, governments, and infrastructure operators.
This continuous view can help organizations move from one-time disaster response toward longer-term risk management and resilience planning.
Bringing Information Closer to Action in a Fast-Moving Disaster
The Bald Range wildfire demonstrates that obtaining data is only part of the challenge. The greater difficulty is ensuring that observations from different sources become usable information inside operational workflows before conditions change again.
Satellite-derived information should be used to support regional situational awareness, change detection, exposure analysis and monitoring priorities. It cannot replace incident command, field verification or official evacuation guidance, and it should not be used independently to determine whether a road or community is safe.
A practical disaster-monitoring workflow may include:
- Defining the operational requirement — identifying the area of interest, the decisions the information must support and the required update frequency.
- Selecting appropriate data sources — matching thermal, optical, SAR, weather, terrain and asset data to the operational question.
- Coordinating acquisition and processing — accounting for revisit frequency, spatial resolution, cloud cover, latency and data availability.
- Integrating multiple datasets — combining satellite observations with official perimeters, field reports, roads, communities and critical infrastructure.
- Delivering information into existing systems — providing alerts, maps, APIs or analytical outputs in formats that fit the client’s GIS or operational environment.
- Validating performance — assessing timeliness, accuracy, usability and operational value against an agreed set of pilot objectives.
STARPATH GLOBAL’s Forward Deployed Engineer model helps organizations design and implement these workflows around their actual operational requirements. Rather than beginning with a particular satellite product, our engineers begin with the client’s area of interest, decision process and delivery needs, then identify the data sources and technical architecture required to support them.
Through the STARPATH GLOBAL Pioneer Partner Program, selected organizations can assess a focused disaster-monitoring use case before making a broader procurement commitment. Participants provide an area of interest, an operational objective and a desired update frequency. STARPATH then evaluates suitable data sources, identifies technical and observational limitations, and designs a pilot workflow with measurable performance criteria.
Satellite data is only one component of emergency response and should always complement official emergency-management systems and field operations. The strongest results come when these capabilities are designed, tested and integrated before the next emergency—not introduced only after an event has already escalated.
Assess a Disaster-Monitoring Use Case with STARPATH GLOBAL
Share your area of interest, operational objective and required update frequency. Our team will assess relevant satellite data sources and outline a focused pilot workflow for wildfire, flood, infrastructure or environmental monitoring. Discuss a Pilot Use Case→
References
- Associated Press:https://apnews.com/article/wildfire-canada-evacuation-british-columbia-okanagan-61002c95f641a4060b78195b016fbea3
- BC Wildfire Service:https://wildfiresituation.nrs.gov.bc.ca/
- BC Wildfire Service:https://blog.gov.bc.ca/bcwildfire/summer-2026-seasonal-outlook/
- USGS:https://firms.modaps.eosdis.nasa.gov/usfs/map/