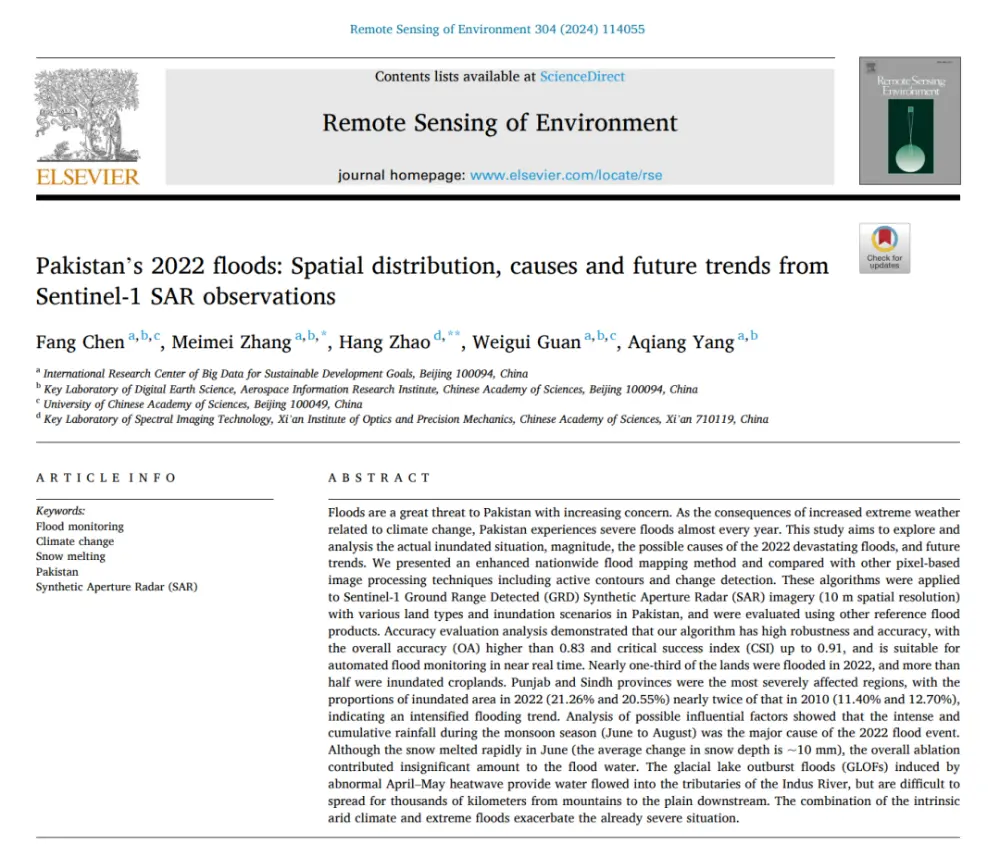
In brief: Published in Remote Sensing of Environment, this study does more than use Sentinel-1 data to map Pakistan’s catastrophic 2022 floods. It seeks to answer three broader questions: How much of the country was flooded? Why was the disaster so severe? And was it worse than the major flood of 2010?
The authors developed an automated flood-mapping workflow combining tile selection, adaptive thresholding and fuzzy-rule refinement. They processed more than 500 Sentinel-1 synthetic aperture radar images covering Pakistan and combined the results with GPM-IMERG precipitation, ERA5-Land snow water equivalent, ground-based temperature records and analyses of glacial lake outburst floods.
The conclusion is clear: the principal driver of the 2022 disaster was roughly 12 weeks of extreme cumulative monsoon rainfall. Snowmelt and glacial lake outburst floods, or GLOFs, were more likely to have played localized or amplifying roles.
1. The Study Addresses More Than Where Flooding Occurred
Pakistan’s 2022 floods were among the most severe disasters to affect South Asia in recent years. For an event of this scale, simply identifying where water appeared is not enough.
Pakistan encompasses snow- and ice-covered mountains in the north, agricultural plains in its central regions, arid terrain in the south and coastal areas. In SAR imagery, deserts, radar shadows, permanent water bodies and complex urban scattering can all produce false detections that resemble floodwater.
At the same time, several possible causes were proposed after the disaster, including abnormal monsoon rainfall, accelerated snowmelt following extreme spring heat and glacial lake outburst floods.
The authors therefore designed a complete research chain:
Automated nationwide flood mapping → disaster quantification → comparison between 2010 and 2022 → diagnosis of rainfall, snowmelt and GLOF contributions
This integrated approach makes the paper more comprehensive than a conventional SAR classification study.
2. Why Did the Authors Not Simply Use Deep Learning?
The paper specifically discusses deep-learning methods such as convolutional neural networks, graph neural networks and generative adversarial networks. The authors do not dispute their potential accuracy. Instead, they emphasize several practical constraints when these methods are applied nationwide:
- Dependence on reliable training data
- Sensitivity of generalization to data volume and quality
- High computational requirements
- Limited interpretability
Active contour models also require manually defined initial contours and can be computationally intensive. Simple change-detection methods, meanwhile, may overclassify isolated changed pixels as floodwater.
The authors therefore chose an interpretable statistical SAR-processing workflow designed for automation rather than a more complex neural network.
Its objective can be summarized as follows:
Minimize dependence on manual initialization, high-resolution DEM constraints and training samples while enabling stable operation across Pakistan’s highly varied surface environments.
3. Two Central Questions: How Can the Threshold Be Selected Automatically, and How Can False Flood Detections Be Removed?
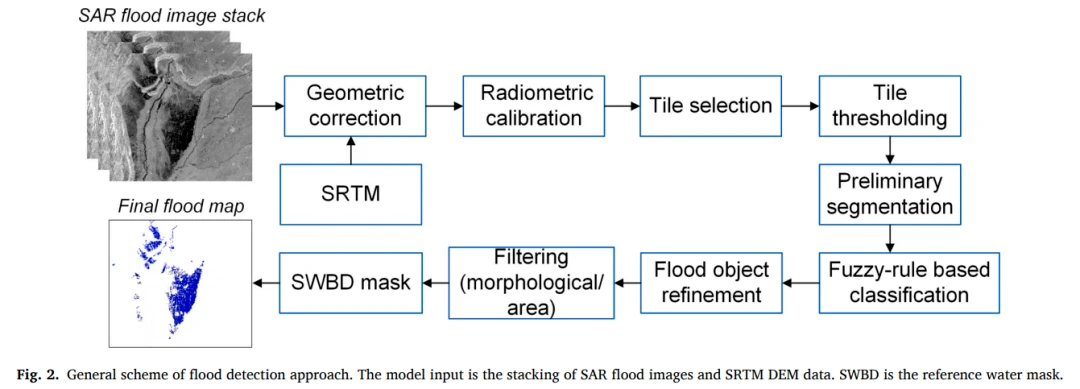
The workflow presented in Fig. 2 can be condensed into the following sequence:
Sentinel-1 image stack → SAR preprocessing → tile selection → tile thresholding → initial flood segmentation → fuzzy-rule refinement → morphological processing → permanent-water removal → final flood map
The first stage addresses one question:
How should the water-detection threshold be determined automatically?
The second addresses another:
Does an area with low radar backscatter actually represent flooding?
These are two of the most common obstacles in large-area SAR flood mapping.
4. First Innovation: Select the Most Distinguishable Tiles Instead of Forcing One Threshold Across the Entire Image
The most straightforward approach to SAR flood detection is based on a simple principle:
Smooth water surfaces generally produce low backscatter and therefore appear dark in radar imagery.
The problem is that a nationwide image may simultaneously contain cropland, cities, deserts, mountains and water. Its overall histogram may not have a clearly defined bimodal distribution.
The authors therefore divided each image into 200 × 200-pixel tiles. They then used the Ashman coefficient to measure the separability of different statistical distributions and retained the five tiles with the highest coefficients.
The Kittler–Illingworth minimum-error thresholding method was then applied to these local areas, where water and non-water surfaces were most readily distinguishable.
The most transferable idea here is not a particular equation. It is the decision to avoid forcing an entire heterogeneous image to follow a bimodal distribution. Instead, the method automatically identifies local areas with the clearest water–land separation and uses them to determine an appropriate threshold.
This makes the approach better suited to large images and heterogeneous terrain than a single fixed global threshold.
5. Second Innovation: Low Backscatter Does Not Necessarily Mean Water
Even when a threshold is well selected, a dark region in a SAR image does not always represent water.
Common sources of false detections include:
- Deserts
- Mountain shadows
- Some permanent water bodies
- Low-backscatter terrain
- Local image noise
The authors therefore introduced fuzzy rule-based refinement.
Each candidate flood object was evaluated using four types of information:
- Backscatter intensity
- Slope
- Elevation
- Flood-object size
Instead of classifying each condition as simply true or false, the system assigned it a flood-membership value between 0 and 1. A candidate entered the final flood class only when its combined membership value exceeded 0.6.
This is more flexible than declaring every pixel below a fixed decibel threshold to be water.
A pixel with slightly higher backscatter may still be retained if it lies at low elevation, on a gentle slope and within or alongside a large, connected flooded area.
This is especially valuable around flood boundaries, partially submerged vegetation and complex background surfaces.
6. Why Were Morphological Processing and a Permanent-Water Mask Still Necessary?
Even after fuzzy classification, the results may contain fragmented patches, small holes and broken boundaries.
The authors applied dilation and closing operations using a 3 × 3 window to fill small gaps and improve boundary continuity. They then used the SRTM Water Body Data to remove permanent rivers and lakes, while isolated flood objects containing fewer than 30 pixels were also discarded.
The final method is therefore not a one-step threshold classification. It is a complete workflow combining:
Statistical segmentation + fuzzy terrain constraints + spatial object filtering
7. Why Did the Authors Design Four Different Flood Scenarios?
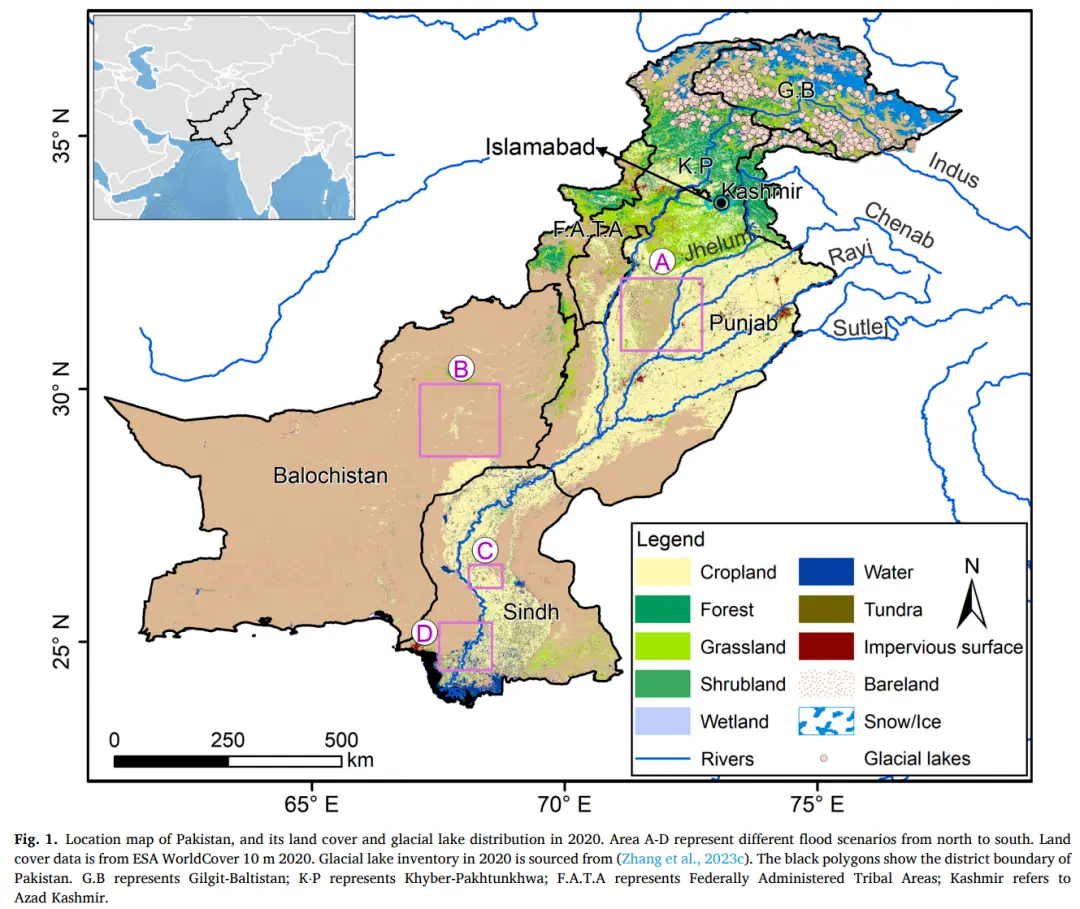
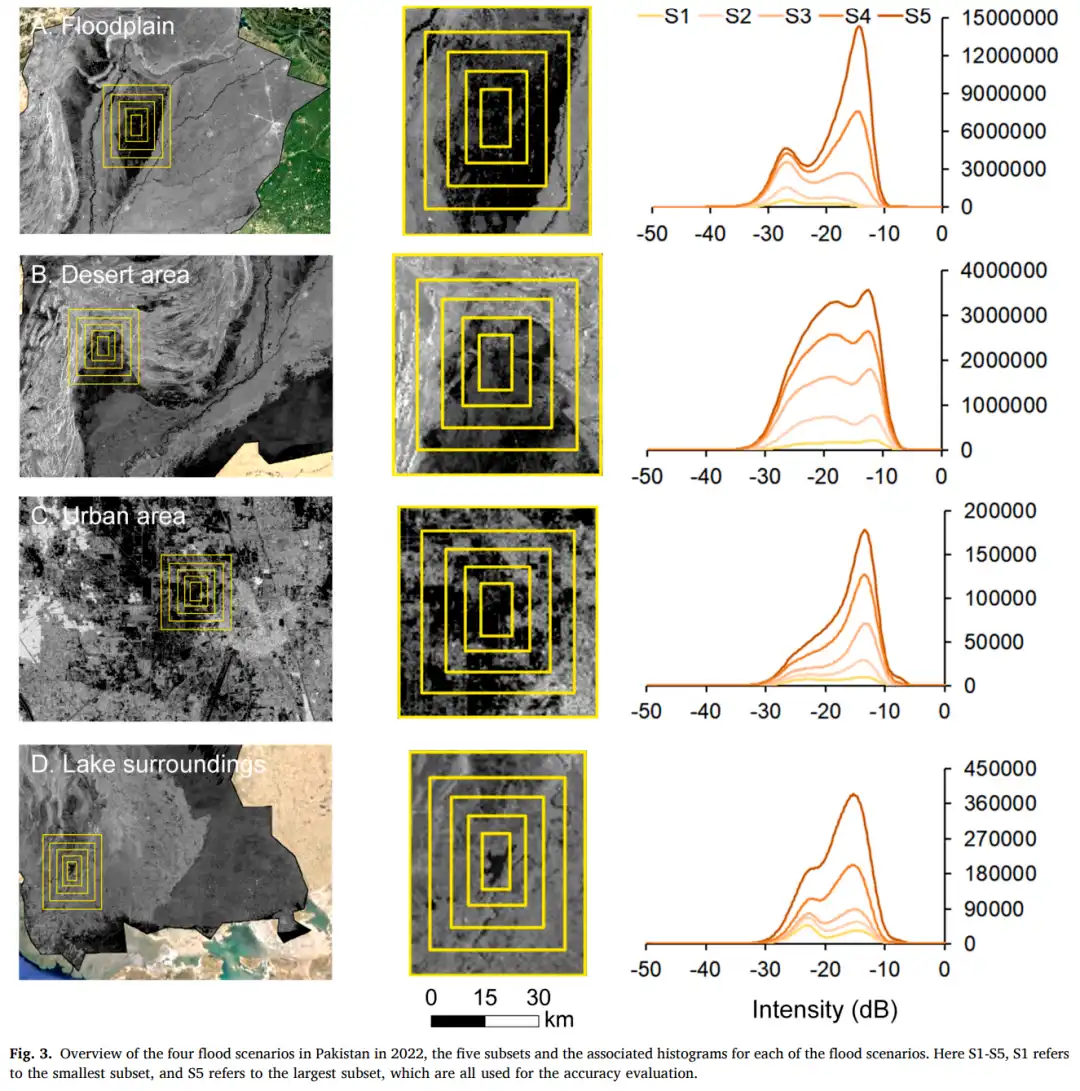
To test nationwide generalizability, the researchers selected four representative environments:
- A: Floodplain
- B: Desert
- C: Urban area
- D: Lake surroundings
These environments correspond to four of the most common challenges in SAR flood detection.
Floodplain inundation tends to be extensive and spatially continuous, although tall vegetation may increase radar backscatter. Desert surfaces may already appear dark. Urban flooding can be affected by double-bounce scattering. Around lakes, the method must distinguish permanent water from newly inundated land.
Fig. 3 shows that the degree of bimodality in the backscatter histograms differs substantially between these environments. The statistical distributions also change when the size of the analysis area is expanded, even within the same type of environment.
This demonstrates why a fixed global threshold is unlikely to perform reliably across an entire country.
8. How Much Did the Method Improve Performance?
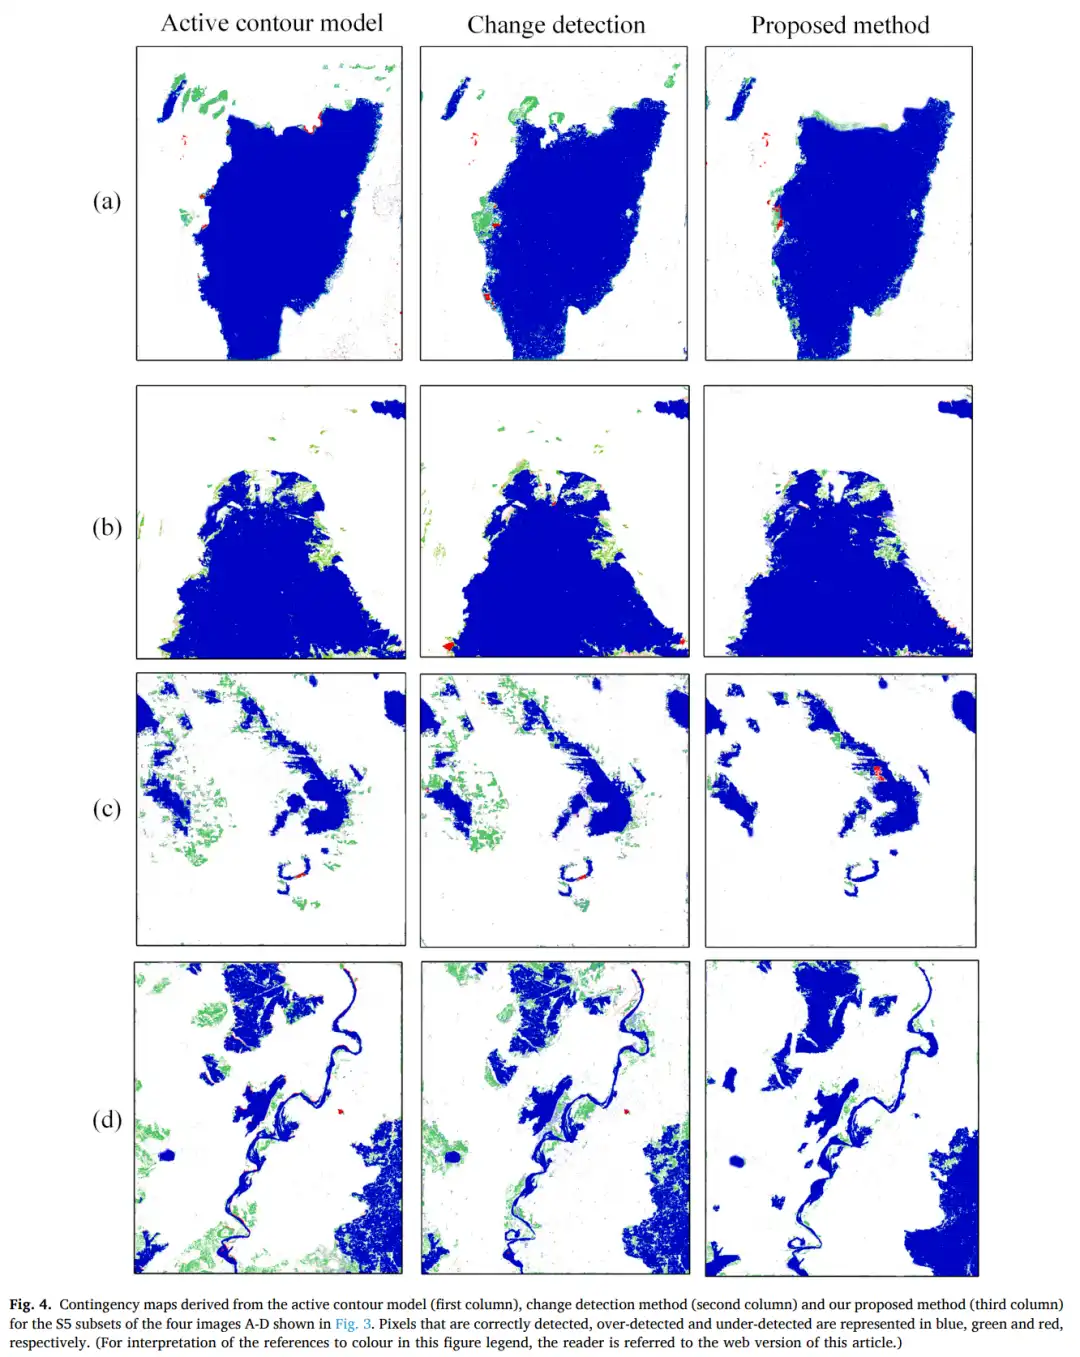
The authors compared their method with an active contour model and a change-detection approach.
Across the four largest S5 test areas, the proposed method achieved approximate overall accuracy values of:
- Floodplain: 0.87
- Desert: 0.83
- Urban: 0.92
- Lake surroundings: 0.94
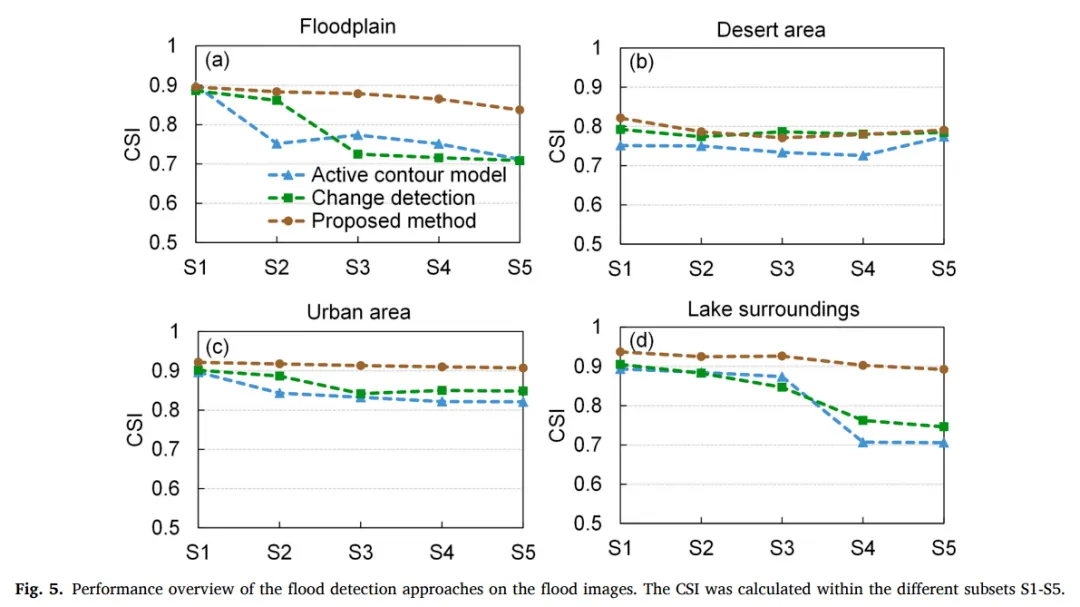
Its Critical Success Index values were approximately:
- Floodplain: 0.84
- Desert: 0.79
- Urban: 0.91
- Lake surroundings: 0.89
The largest improvements occurred in urban areas and around lakes.
In the urban scenario, for example, the proposed method achieved a CSI of approximately 0.91, compared with about 0.82 for the active contour model and 0.85 for change detection. Around lakes, its CSI was approximately 0.89, compared with about 0.71 and 0.75 for the other two methods.
Performance among the three methods was more similar in desert areas because sandy surfaces inherently have a relatively low SAR signal-to-noise ratio.
The paper’s central claim is therefore not simply that the proposed method produces the highest accuracy. Its real advantage is stability: it remains more robust in complex environments, and its accuracy declines more slowly as the analysis area expands.
That is more relevant to operational nationwide flood mapping than achieving maximum accuracy within a single, limited test area.
9. How Extensive Were the 2022 Floods?
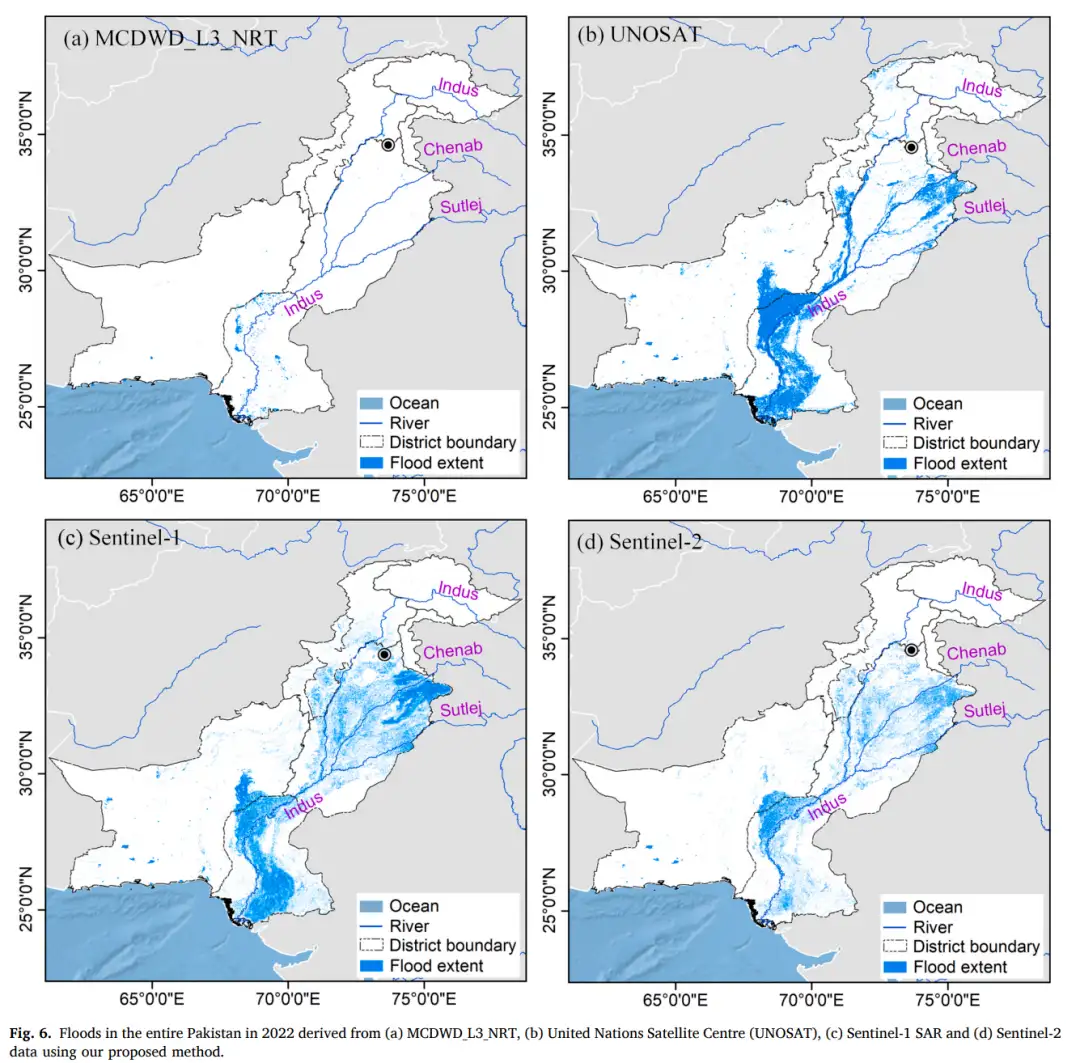
The authors mapped the disaster using more than 500 Sentinel-1 Ground Range Detected images acquired in VV polarization between June and August 2022.
The Sentinel-1 results showed an overall agreement of approximately 82% with UNOSAT flood products while identifying a more complete inundation extent.
Across the approximately 796,000 km² area analyzed in the paper, the authors concluded that:
Nearly one-third of the land was affected by flooding during the 2022 disaster season.
More than half of the inundated area was agricultural land.
The disaster therefore involved far more than water appearing along river channels. It directly affected some of Pakistan’s most important agricultural production regions.
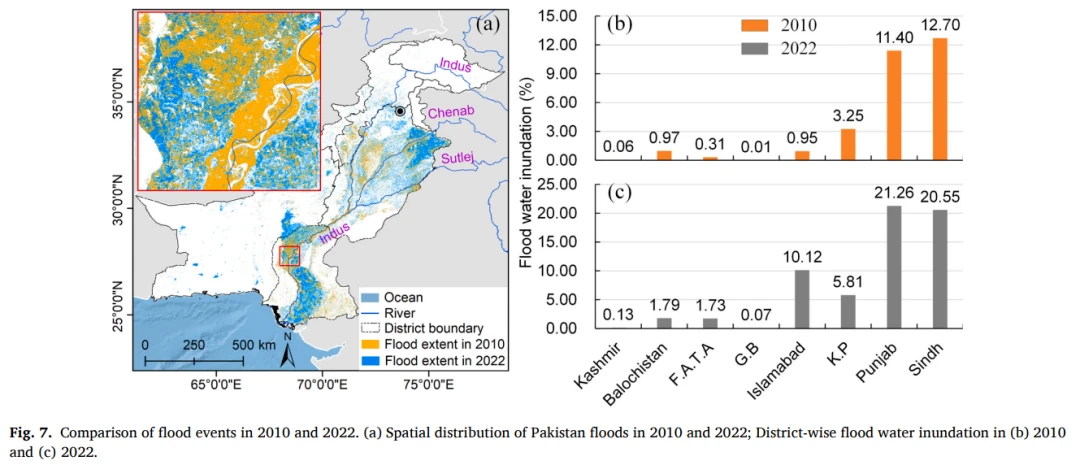
10. Flooding in Punjab and Sindh Nearly Doubled Compared with 2010
The paper also compares the 2022 disaster with Pakistan’s major floods of 2010.
The estimated flooded share of Punjab increased from:
2010: 11.40% → 2022: 21.26%
In Sindh, it increased from:
2010: 12.70% → 2022: 20.55%
In both provinces, the inundated share in 2022 was close to twice the 2010 level.
Approximately 11,000 km² of agricultural land was flooded in Sindh. By combining the flood maps with WorldPop data, the authors estimated that in August 2022:
At least 22 million people may have been exposed to flooding or lived near flooded areas.
It is important to clarify what the paper means when discussing “future trends.” It does not provide a rigorous simulation of future climate scenarios. Instead, it compares two major disasters—2010 and 2022—and discusses the apparent escalation in risk within the context of ongoing climatic and human pressures.
A more precise conclusion is therefore:
The two major floods show clear signs of intensification, but they do not by themselves prove that Pakistan’s flooded area is increasing monotonically over the long term.
11. Was the Disaster Caused by Snowmelt Following the Spring Heatwave?
Northern Pakistan experienced an exceptional heatwave between March and May 2022. In some areas, late-April temperatures were approximately 5°C above normal.
Such conditions could clearly accelerate the melting of seasonal snow and glaciers.
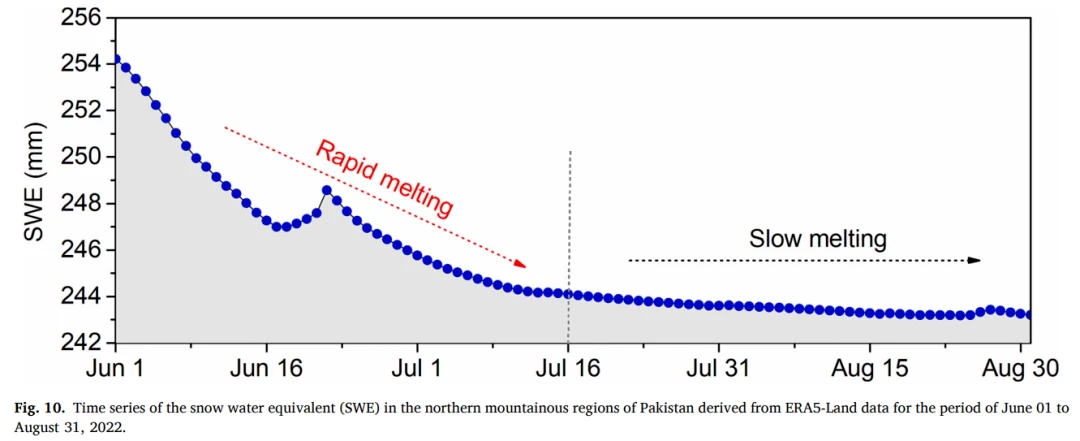
The authors therefore analyzed snow water equivalent using ERA5-Land. Their results showed that SWE declined rapidly across the northern mountains in June, with the change in average snow depth amounting to approximately 10 mm.
From July to August, however, the decline in SWE was already limited—precisely when the most severe flooding occurred.
The paper therefore concludes that:
Snowmelt occurred, but the total meltwater contribution was insufficient to explain the nationwide scale of the 2022 floods. Snowmelt was not the dominant driver.
This distinction is important: the presence of a process does not necessarily make it the principal cause.
12. Were Glacial Lake Outburst Floods the Main Cause?
Several GLOFs did occur in northern Pakistan in 2022.
One example was the May 7 failure of an ice-dammed lake at Shisper Glacier in the Hunza Valley. The paper estimates a potential flood volume of approximately 6.23 million m³ and a flood path of about 9 km. The event also damaged a bridge.
Additional glacial lake outburst floods occurred in late June and early July.
GLOFs therefore caused genuine disasters in mountainous areas. However, the authors argue that these events were geographically localized. They could not readily propagate for thousands of kilometers from the northern mountains and directly account for widespread flooding across the southern plains.
A more reasonable conclusion is:
GLOFs can increase tributary flows, trigger localized flash floods and amplify downstream flood risk during particular periods, but they were unlikely to have supplied most of the water responsible for Pakistan’s nationwide disaster.
13. The Main Cause Was Not One Day of Exceptional Rain, but 12 Consecutive Weeks of Accumulation
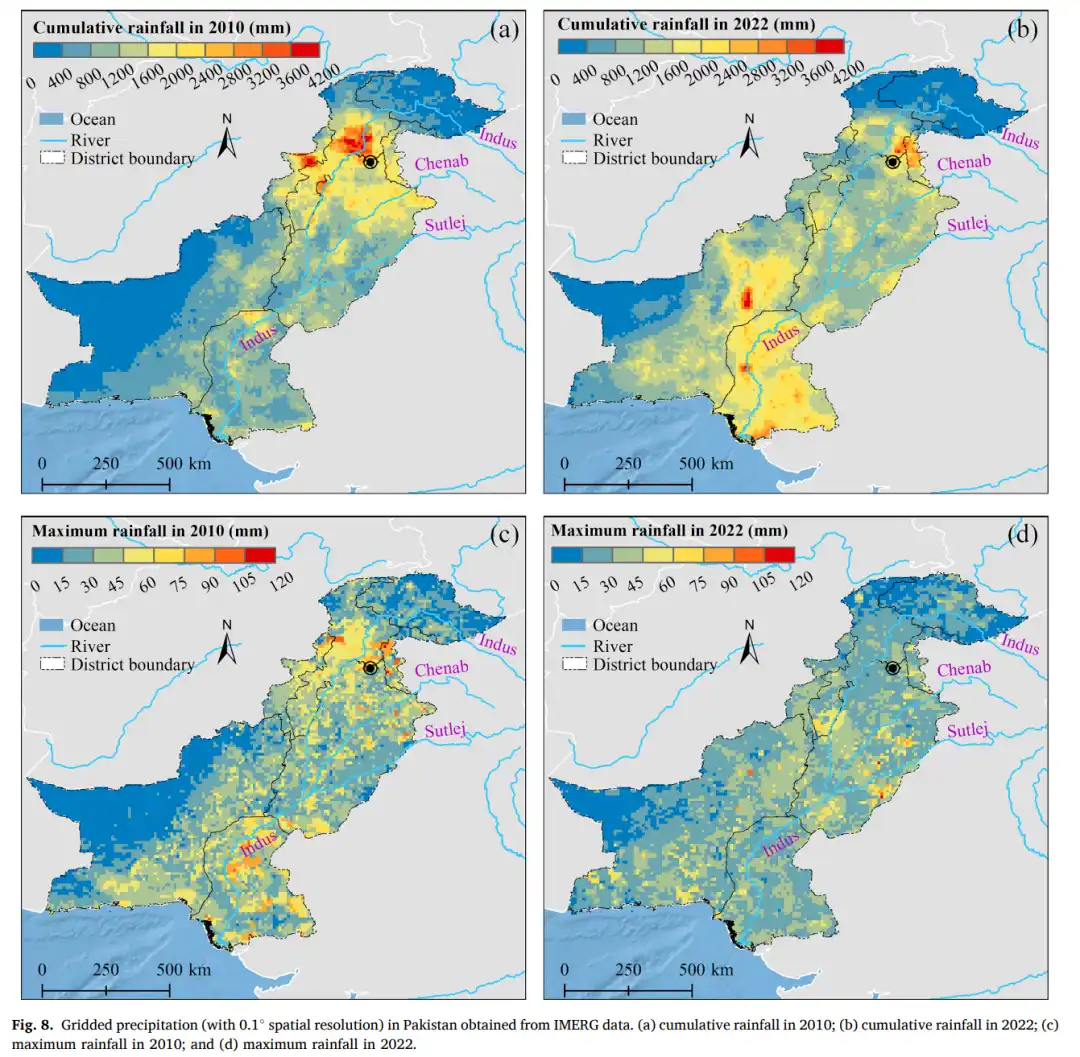
The authors analyzed the 2010 and 2022 monsoon seasons using half-hourly GPM-IMERG precipitation data.
Exceptionally persistent heavy rainfall affected Pakistan from June through August 2022. In parts of Sindh and Balochistan, cumulative rainfall reached approximately 4,200 mm.
One particularly important finding was that the maximum rainfall from an individual event did not correspond especially well with the spatial pattern of flooding.
What matched the inundation extent much more closely was:
Cumulative rainfall
The authors therefore concluded that the 2022 floods were the direct result of monsoon rainfall accumulating over approximately 12 weeks.
This was not simply a case of one day producing too much rain. Rivers, soils and low-lying areas received continuous water inputs for months, eventually producing widespread cumulative flooding.
The three contributing factors can be ranked as follows:
- Persistent monsoon rainfall: dominant driver
- Snow and ice meltwater: secondary contribution
- GLOFs: localized amplification
This is the central conclusion of the paper’s causal analysis.
14. How Did Pakistan’s Terrain Amplify the Effects of Persistent Monsoon Rainfall?
Pakistan borders the Arabian Sea to the south. Its terrain is elevated in the north and west and generally lower in the south and east, while the Indus River runs through the country from north to south.
During an active South Asian monsoon, large volumes of warm, moisture-laden air move inland from the ocean. The Himalayas and other high terrain force the air upward, while monsoon troughs and cyclonic activity repeatedly trigger heavy rainfall.
Precipitation can intensify further when cold air from Central Asia meets the warm, moist monsoon flow.
Pakistan’s underlying flood setting can therefore be summarized as:
Marine moisture transport + orographic uplift + Indus River convergence + low-lying downstream terrain
When this atmospheric and topographic combination persists for weeks, the likelihood of extensive downstream flooding increases sharply.
15. What Is the Study’s Real Innovation?
Describing the paper simply as proposing a fuzzy rule-based flood-detection method does not fully capture its contribution.
First: Automated Tile Selection Replaces a Fixed Threshold for the Entire Image
Instead of manually selecting a water threshold for each image, the workflow automatically identifies local areas with the strongest statistical separation between water and land and then calculates the threshold from those areas.
Second: Fuzzy Object Refinement Follows Threshold Segmentation
Backscatter, slope, elevation and object size are evaluated together, reducing the risk of classifying every dark surface as floodwater.
Third: The Method Is Tested Across Four Complex Environments
The authors did not limit validation to relatively straightforward floodplain inundation. They also tested the method in deserts, urban areas and locations surrounding permanent lakes.
Fourth: The Workflow Was Scaled to More Than 500 SAR Images Nationwide
This is arguably the paper’s most important engineering contribution.
The central problem addressed by the authors is:
Can large volumes of SAR flood imagery from highly varied environments across an entire country be processed consistently without manually redrawing boundaries or retuning parameters for every region?
Conclusion: What Really Supplied the Water Behind Pakistan’s 2022 Floods?
The study can be condensed into the following analytical chain:
Sentinel-1 SAR → tile selection → KI adaptive thresholding → fuzzy-rule refinement → nationwide flood map → 2010–2022 comparison → agricultural and population exposure → IMERG precipitation + ERA5-Land SWE + GLOF analysis → causal assessment
Three conclusions stand out.
First, the 2022 flood extent was enormous. Nearly one-third of the analyzed area was affected, more than half of the inundated land was agricultural, and the flooded shares of Punjab and Sindh were substantially higher than in 2010.
Second, snowmelt and GLOFs were not the main causes of the nationwide disaster. The spring heatwave accelerated melting and contributed to glacial lake outburst floods, but these processes mainly had localized or supplementary effects.
Third, approximately 12 weeks of exceptional cumulative monsoon rainfall were the dominant driver of the nationwide flooding.
The paper’s broader conclusion is therefore that Pakistan’s 2022 floods were not a single-point extreme event. They resulted from sustained water inputs accumulating over an extended period within the country’s distinctive terrain and the Indus River system.
For governments, insurers, agricultural organizations and emergency-response teams, effective flood monitoring depends on selecting imagery with the right balance of resolution, coverage, revisit frequency and cost. STARPATH GLOBAL helps international customers explore fit-for-purpose satellite imagery supported by China’s expanding remote-sensing capacity, avoiding unnecessary spending on data that exceed operational requirements. Organizations can discuss your monitoring needs with our team or apply to the Pioneer Partner Program, where Forward Deployed Engineers help define high-value use cases, test feasibility and build internal remote-sensing capabilities.
Paper Information
Title: Pakistan’s 2022 Floods: Spatial Distribution, Causes and Future Trends from Sentinel-1 SAR Observations
Journal: Remote Sensing of Environment
Year: 2024
Volume: 304
Article number: 114055
Authors: Fang Chen, Meimei Zhang, Hang Zhao, Weigui Guan and Aqiang Yang
DOI: 10.1016/j.rse.2024.114055
Study area: Pakistan
Primary datasets: Sentinel-1 GRD VV, SRTM DEM, SWBD, ESA WorldCover, GPM-IMERG, ERA5-Land SWE, Pakistan Meteorological Department ground-based temperature records, WorldPop, UNOSAT flood products and MODIS flood products.