In brief: Conventional SAR-based flood mapping often runs into two obstacles: thresholds must be adjusted repeatedly by hand, while supervised learning requires large volumes of labeled data. This paper proposes Felz-CNN, also known as the adaptive unsupervised Felz-CNN segment system (AUFCS). The method first uses Felzenszwalb superpixels to divide a SAR image into many internally consistent regions. A convolutional neural network then learns from these “pseudo-labels” and automatically merges the superpixels, allowing the system to extract water without manually labeled training data. The authors applied the method to the 2020 floods in the middle and lower reaches of the Yangtze River, covering a study area of approximately 1.14 million km². What makes the paper particularly instructive, however, is not just its “unsupervised CNN.” It also shows how superpixels can suppress SAR speckle, how a DEM can help remove terrain shadows, and why several sets of accuracy figures reported in the paper should not be treated as interchangeable.
After a flood, the real challenge is often not whether satellites are available, but whether the incoming satellite data can be turned into a flood map quickly and with as little human intervention as possible.
Synthetic aperture radar, or SAR, is particularly well suited to emergency flood response.
It can see through clouds and operate day or night, making it more dependable than optical satellites during periods of heavy rainfall.
Yet conventional SAR flood-mapping workflows often require people to choose:
- water-detection thresholds;
- segmentation scales;
- change-detection parameters; and
- training samples.
Once the study area expands from a single city to hundreds of thousands—or even more than one million—square kilometers, a threshold that works in one place may no longer work elsewhere.
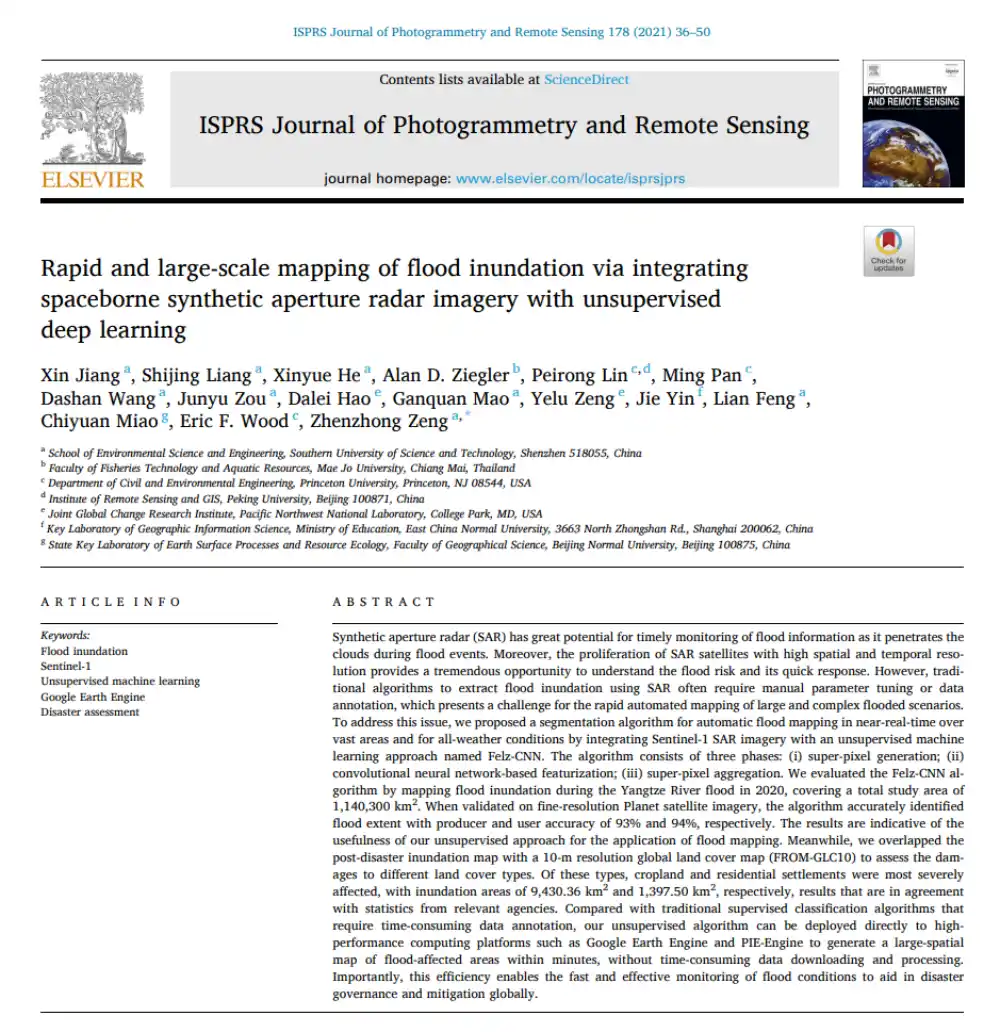
In 2021, Xin Jiang, Shijing Liang, Xinyue He, Alan D. Ziegler, Peirong Lin, Ming Pan, Zhenzhong Zeng and their co-authors published a paper in the ISPRS Journal of Photogrammetry and Remote Sensing titled:
Rapid and large-scale mapping of flood inundation via integrating spaceborne synthetic aperture radar imagery with unsupervised deep learning
The authors proposed an unsupervised flood-mapping method called Felz-CNN. Its central question was straightforward:
Can large-scale floods be mapped rapidly without manually labeled training data and without retuning a water threshold for every region?
1. Why Is Manual Threshold Tuning Especially Troublesome for Large-Scale Flood Mapping?
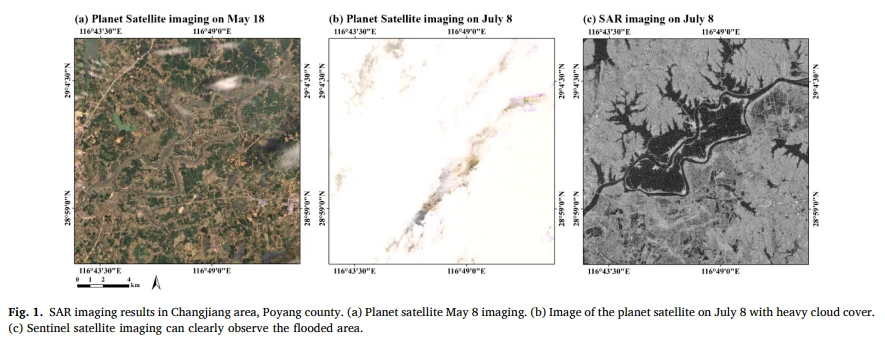
The basic logic behind many SAR flood-mapping algorithms is simple:
Lower backscatter → possible water.
The problem is that SAR imagery is not uniform.
Backscatter can be affected by regional differences in:
- terrain;
- land cover;
- soil moisture;
- water-surface roughness;
- incidence angle; and
- vegetation structure.
A fixed threshold that performs well at Poyang Lake may therefore produce extensive false detections when applied in the mountainous areas of Hubei or near urban areas.
Supervised learning can reduce dependence on manually selected thresholds, but it introduces another cost: people must first label large numbers of flood samples before training the model.
For a sudden disaster, that workflow makes it difficult to produce a map as soon as the data arrive.
Instead of designing yet another, more complicated fixed threshold, the authors reframed the problem:
Could the image itself generate the initial labels, allowing a CNN to continue learning and clustering from them?
That is the basic idea behind Felz-CNN.
2. “Unsupervised Deep Learning” Does Not Mean the CNN Has No Labels at All
This is the most important point for understanding the paper.
The authors describe Felz-CNN as unsupervised deep learning, but the process is not equivalent to:
“Feed a SAR image into a CNN, give the network no information, and let it suddenly learn what a flood is.”
What actually happens is:
Step 1: A superpixel algorithm automatically generates fine-grained initial labels.
Step 2: The CNN treats these automatically generated labels as pseudo-labels and continues learning image features from them.
Step 3: The CNN repeatedly reassigns classes, after which a majority vote is used to assign a single label to all pixels within each superpixel.
In this context, “unsupervised” means:
No manually prepared training labels are required.
It does not mean:
The entire optimization process operates without any labels whatsoever.
The approach is better understood as:
Automatic pseudo-labeling + self-learning clustering + superpixel constraints.
Once this distinction is clear, the rest of the Felz-CNN workflow becomes much easier to understand.
3. Why Divide the Image into Superpixels Instead of Training Directly on Individual Pixels?
One of the biggest problems with SAR imagery is speckle.
Even across the same body of water, some pixels may appear bright while others appear dark.
Pixel-by-pixel classification can therefore produce:
A large water body filled with salt-and-pepper noise.
To address this problem, the authors first group adjacent pixels with similar features into superpixels.
One way to visualize the process is to imagine cutting an image into many small puzzle pieces. In the subsequent stages, individual pixels no longer make independent decisions. Instead, each small region collectively determines the class to which it belongs.
This has two immediate advantages.
First, speckle noise is less likely to push an individual pixel into the wrong class.
Second, rather than treating a vast number of pixels as fully independent observations, the CNN can exploit spatial consistency within each region.
The paper argues that this helps the algorithm balance processing speed with preservation of spatial boundaries.
4. Why Felzenszwalb Rather Than SLIC or Watershed?
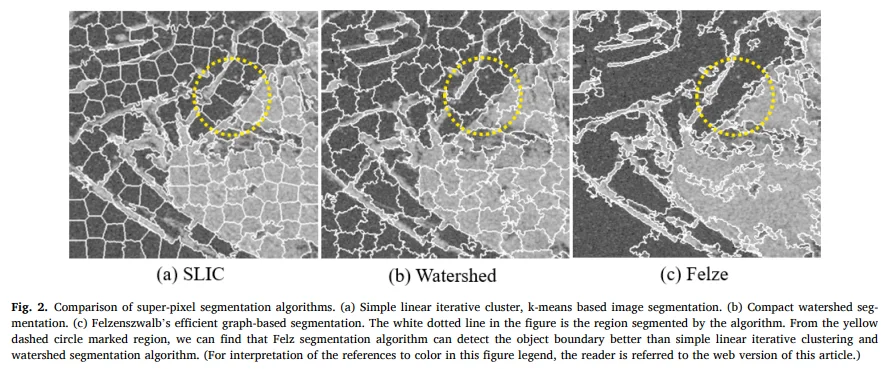
The authors compared three superpixel methods:
- SLIC;
- watershed; and
- Felzenszwalb, abbreviated as Felz.
Figure 2 on page 4 of the paper provides an intuitive comparison.
SLIC tends to produce relatively regular, block-like regions. Watershed relies on gradients. Felz, by contrast, is graph-based and dynamically determines whether adjacent regions should continue to be merged according to differences within and between them.
The authors argue that Felz preserves the boundaries of real-world objects more naturally.
However, the discussion later in the paper adds an important qualification:
When the initial labels are sufficiently fine-grained, the differences among the three segmentation methods in the final water-detection results are not as large as one might expect.
The more obvious difference lies in:
Runtime efficiency.
In other words, the authors ultimately selected Felz-CNN not simply because its boundaries were necessarily the most accurate in every case, but because it offered a more suitable balance between speed and performance for emergency flood response.
5. How Does Felz-CNN Work? In Essence: Segment Finely, Then Merge Iteratively
The entire algorithm can be condensed into three operations.
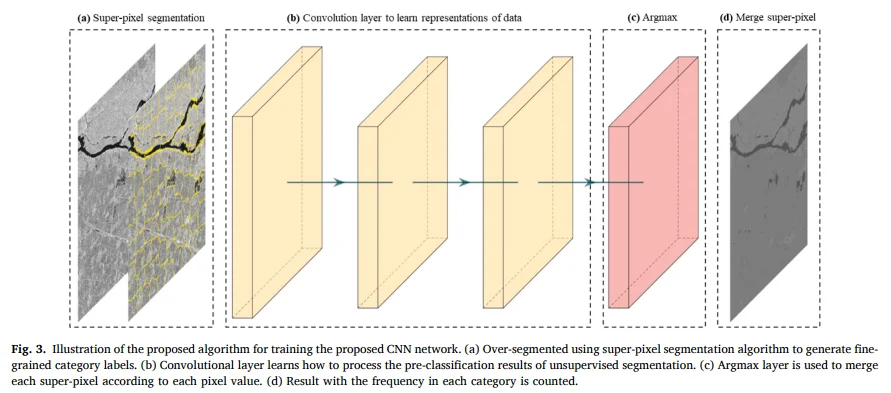
1. Superpixel generation
Felz first oversegments the SAR image into many small regions.
Each region receives an initial class label.
These labels are not produced by human annotators; they are generated automatically by the algorithm.
2. CNN feature learning and reclassification
The paper uses a relatively simple three-layer convolutional architecture.
The CNN reads the original SAR image and extracts multidimensional features for each pixel. An Argmax operation then reassigns each pixel to a class.
The training objective is derived from the pseudo-labels at the current stage. Through repeated iterations, the CNN simultaneously updates:
Image-feature representations + pixel classes.
3. Majority voting within each superpixel
For each superpixel, the algorithm determines which class appears most frequently.
It then assigns that majority class to the entire superpixel.
The updated result is fed back into the CNN for further training.
Felz-CNN is therefore not a one-pass classifier. Its workflow is:
Initial superpixel segmentation → CNN learning → regional majority-based merging → further learning → further merging.
Through this iterative process, the fine, fragmented initial regions are gradually consolidated into more stable land-cover classes.
6. How Does the Method Deal With One of SAR’s Classic Sources of False Water Detections: Terrain Shadow?
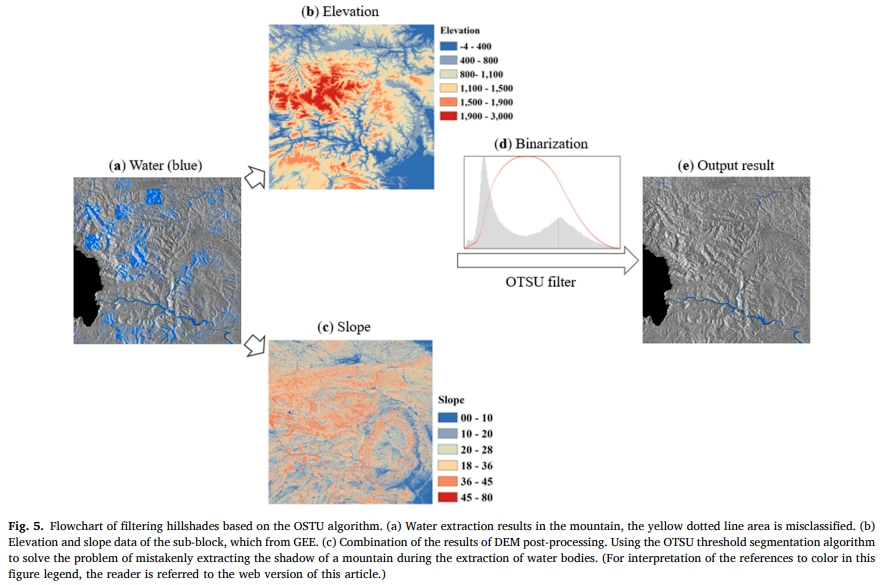
Unsupervised clustering alone is not enough.
Mountainous terrain creates a familiar problem:
Radar shadows also appear dark.
In terms of SAR intensity, they can look very similar to water.
The authors therefore introduced an additional combination of:
SRTM DEM + slope + Otsu thresholding.
The basic logic is:
If a candidate “water” area is located at a relatively high elevation and also has a pronounced slope, it is more likely to be terrain shadow than genuine standing water.
The paper applies Otsu’s method to automatically segment local elevation and slope, then combines those results with the water candidates produced by Felz-CNN to remove high-elevation terrain shadows.
This point is important.
Although Felz-CNN is described as “unsupervised deep learning,” the final flood product is not generated by the CNN alone.
The complete workflow is actually:
Unsupervised SAR segmentation + terrain-informed post-processing.
7. How Large Was the Experiment? About 1.14 Million km², Not a Single County
The authors tested the method on the 2020 Yangtze River floods.
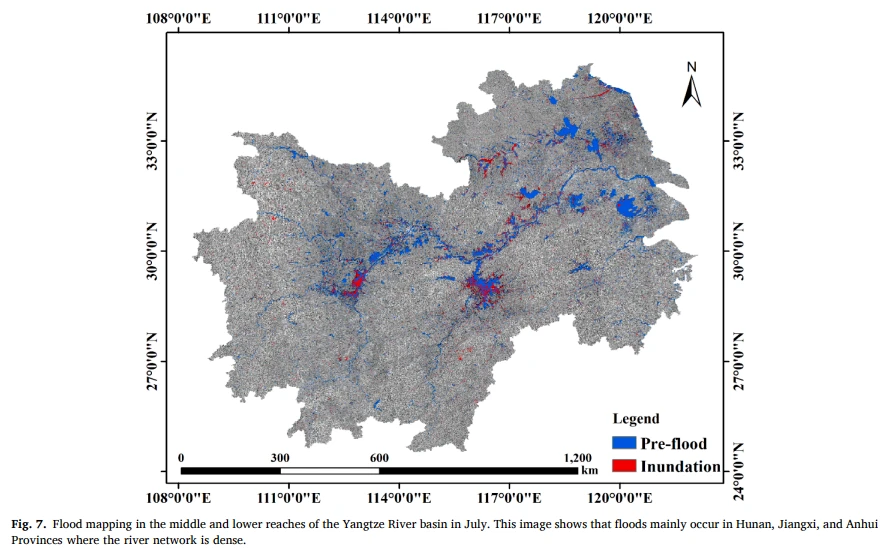
The study covered the middle and lower reaches of the river, with a total area of approximately:
1,140,300 km².
The datasets included:
- Sentinel-1 IW GRD;
- 10 m VV polarization;
- the 30 m SRTM DEM;
- the FROM-GLC10 land-cover dataset; and
- 3 m Planet optical imagery for validation.
The SAR data underwent standard preprocessing in Google Earth Engine, including:
- orbit-error correction;
- removal of edge noise and low-intensity noise;
- radiometric calibration;
- terrain correction; and
- conversion of backscatter to decibels.
One detail is especially important:
The paper ultimately used only VV polarization for flood mapping. It did not actually perform joint VV+VH dual-polarization classification.
The authors selected VV primarily for computational efficiency and based on previous experience in flood detection.
8. What Did the Method Extract From the 2020 Yangtze River Floods?
The paper estimated a total flooded area in July 2020 of approximately:
13,461.81 km².
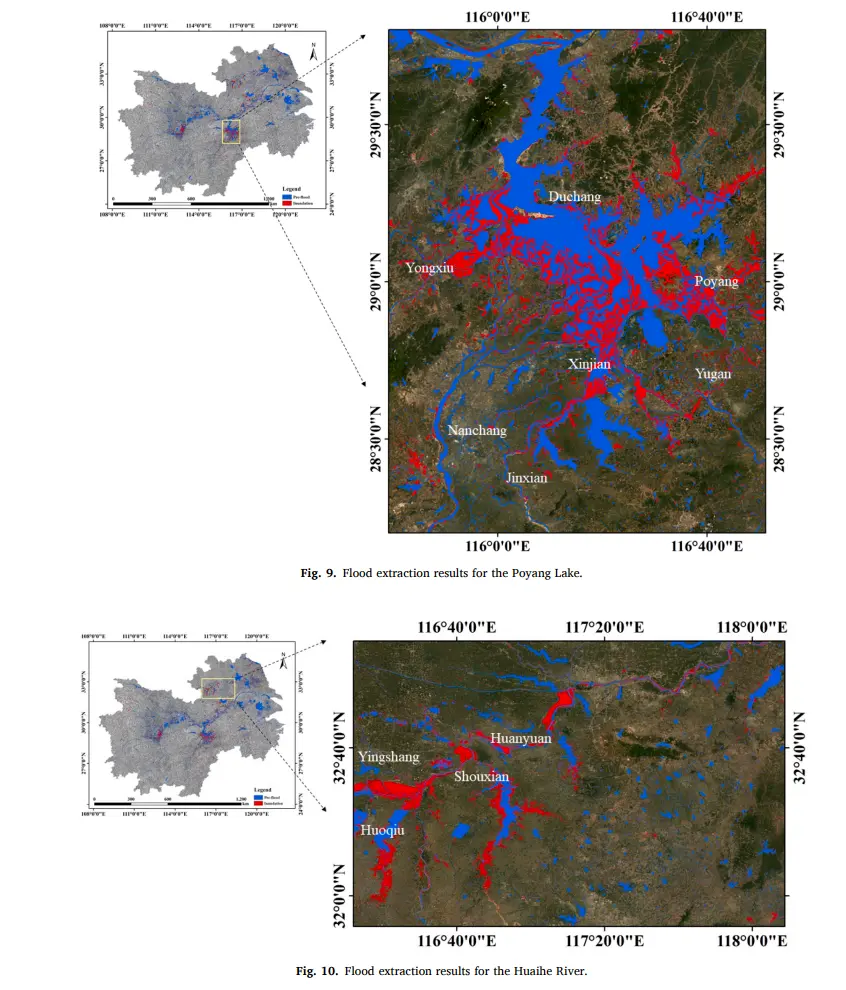
Spatially, the flooding was concentrated mainly in:
- Hunan;
- Jiangxi;
- Anhui; and
- areas around large lakes, rivers, canals and low-lying terrain.
Several major affected areas included:
- Poyang Lake and the related Huai River area: approximately 3,566.47 km²;
- the Dongting Lake area: approximately 1,244.61 km²; and
- a severely flooded area along the lower main stem of the Yangtze River: approximately 350.09 km².
The authors then overlaid the flood map with FROM-GLC10 to calculate inundation by land-cover class.
Cropland was clearly the most heavily affected land-cover class.
Cropland and residential areas together accounted for about 80% of the total inundated area. The study therefore went beyond showing “where the water was” and translated the flood extent into statistics on disaster impacts.
9. How Accurate Was the Validation? The Paper Contains Several Sets of Figures That Are Not Fully Consistent
The authors used 3 m Planet optical imagery for validation.
They randomly selected:
2,000 sample points.
These consisted of:
1,000 true wet points and 1,000 true dry points.
The confusion matrix in Table 3 is:
Calculated directly from this table, the results are:
- Overall accuracy: 92.85%
- Kappa: 85.70%
- Flood producer accuracy: 86.60%
- Flood user accuracy: 98.97%
This pattern is particularly revealing.
It suggests that the Felz-CNN flood map is relatively conservative:
When an area is classified as flooded, it is almost always correct. However, about 13.4% of the actual flooded points are still missed.
In other words:
There are few false positives, but relatively more false negatives.
10. Why Is Four Seconds Fast, Yet Not Evidence That the Entire 1.14 Million km² Was Processed in Only a Few Minutes?
The paper compared several superpixel-CNN combinations on a system equipped with an NVIDIA GeForce GTX 2060 GPU and 16 GB of RAM.
For a 1,000 × 1,000-pixel test image:
The authors also provided an operational-scale estimate:
Each 10 km × 10 km area required approximately four seconds.
They compared this with several methods cited in the paper:
- Fuzzy system: 15 s
- RAPID: 37 s
- ASWE: 31 s
- Felz-CNN: approximately 4 s
Felz-CNN is indeed fast.
There is, however, an easy way to overstate the result:
The paper does not directly report how many minutes were required to process the entire 1.14 million km² study area from raw data to final map.
The phrase “within minutes” in the abstract mainly emphasizes that the algorithm could support rapid, large-scale deployment when combined with high-performance cloud platforms such as Google Earth Engine and PIE-Engine.
The explicitly measured results are the roughly four seconds required for each 10 km × 10 km area and the runtimes of the individual stages for a 1,000 × 1,000-pixel image.
In addition, the performance tests were conducted in a PyTorch environment on a PC equipped with a GTX 2060, while the discussion highlights the potential for future or operational deployment through platforms such as Google Earth Engine, Google Drive and Google Colab.
A more accurate description is therefore:
The method has the potential for minute-scale, large-area parallel deployment, but the paper does not provide a complete end-to-end runtime for the entire 1.14 million km² study area.
11. Where Does the Paper’s Real Innovation Lie?
What makes this paper instructive is not simply that it uses a CNN.
First, it replaces manual labels with superpixel pseudo-labels.
Felz automatically generates fine-grained regions, and the CNN then learns from those regions. This removes the need to create a new manually labeled training set after a flood occurs.
Second, it turns a pixel problem into a region problem.
Superpixels exploit spatial consistency to suppress SAR speckle, so the model does not have to contend with noise one pixel at a time.
Third, the CNN does more than classify: it automatically determines how the superpixels should be merged.
This addresses a common problem in conventional object-based segmentation:
What segmentation scale should be used?
Fourth, it introduces a DEM and Otsu thresholding to remove terrain shadows.
This demonstrates that image statistics alone cannot resolve every source of false water detection in SAR data. Terrain knowledge remains important.
Fifth, the algorithm was designed with cloud computing and operational large-area mapping in mind.
The paper considers not only local accuracy but also processing speed, application across more than one million square kilometers and disaster-impact statistics within the same workflow.
Conclusion: Felz-CNN’s Real Contribution Is Reducing the Flood-Mapping Workflow’s Dependence on People
The method can be summarized in one clear chain:
Sentinel-1 SAR → Felz superpixels → automatic pseudo-labels → CNN self-learning → superpixel merging → DEM/Otsu terrain-shadow removal → flood extent.
It does not rely on a pre-existing, manually labeled flood-training dataset, nor is the entire method built around a single fixed SAR water threshold.
In the 2020 Yangtze River flood experiment, the authors processed a study area of approximately 1.14 million km² and estimated a flooded area of about 13,461.81 km², including approximately 9,430.36 km² of inundated cropland.
Based on the confusion matrix in Table 3, the validation results are best reported as:
Overall accuracy of 92.85%, Kappa of 85.70%, flood producer accuracy of 86.60% and flood user accuracy of 98.97%.
This means the model’s defining characteristic is not that it misses no flooded areas. Rather:
Areas classified as flooded are generally reliable, although the method still misses some real flooding.
From a methodological perspective, the most valuable idea is to use superpixels to move SAR analysis from a noisy “pixel world” into a spatially continuous “region world,” then let the CNN learn how those regions should be merged.
That is closer to the needs of automated, large-scale operational flood mapping than simply continuing the search for a supposedly perfect water threshold.
SAR is particularly valuable for flood monitoring because it can observe affected areas through clouds and at night. In practice, however, the required coverage, revisit frequency, spatial resolution and budget all influence which satellite data are appropriate for a project. Drawing on China’s expanding satellite data capacity, STARPATH GLOBAL helps clients source competitively priced SAR and optical imagery and select fit-for-purpose data through its satellite imagery catalog. Organizations with limited remote-sensing experience can also apply to the Pioneer Partner Program, where Forward Deployed Engineers help define use cases, evaluate feasibility and develop local expertise; those planning a flood-monitoring or emergency-response project can contact our team to discuss suitable data options and project requirements.
Paper Information
Title: Rapid and large-scale mapping of flood inundation via integrating spaceborne synthetic aperture radar imagery with unsupervised deep learning
Authors: Xin Jiang, Shijing Liang, Xinyue He, Alan D. Ziegler, Peirong Lin, Ming Pan, Dashan Wang, Junyu Zou, Dalei Hao, Ganquan Mao, Yelu Zeng, Jie Yin, Lian Feng, Chiyuan Miao, Eric F. Wood and Zhenzhong Zeng
Journal: ISPRS Journal of Photogrammetry and Remote Sensing
Volume and pages: 178 (2021), 36–50
Published online: June 9, 2021
DOI: 10.1016/j.isprsjprs.2021.05.019
Core method: Felz-CNN / adaptive unsupervised Felz-CNN segment system (AUFCS)
Primary datasets: Sentinel-1 VV, SRTM DEM, FROM-GLC10 and Planet imagery