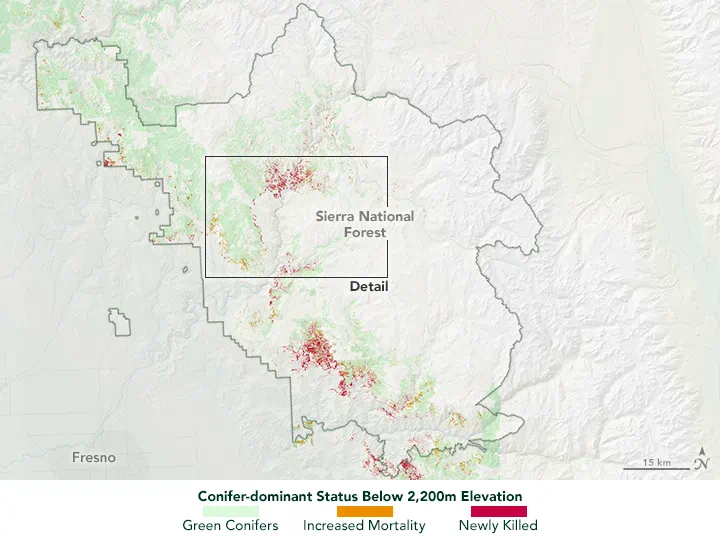
Sometimes, but NDVI alone cannot reliably identify every stressed tree before visible symptoms appear. It can help reveal changes in canopy greenness and vegetation cover, especially when repeated observations show a departure from the forest’s normal seasonal pattern. Early physiological stress, however, may develop while crowns still look green and NDVI changes remain small.
For forest managers, the practical question is therefore: which observations can help decide where to inspect next? A useful monitoring system connects satellite screening, drone assessment and field records, with each providing a different level of evidence.
Discoloration, Defoliation and Physiological Stress Are Different Targets
“Forest health monitoring” can describe several tasks that require different measurements:
- Crown discoloration: needles or leaves change color. RGB imagery may reveal the change once it is sufficiently pronounced, while spectral measurements can provide additional information about pigment-related differences.
- Defoliation: trees lose foliage, changing crown density and exposing branches, understory or soil. Vegetation indices may respond to these structural changes.
- Tree mortality: determining whether a tree is dead requires evidence beyond an isolated low index value. Severe discoloration, foliage loss and repeated observations can support an assessment, with field confirmation where needed.
- Physiological stress before visible symptoms: water transport, stomatal behavior or photosynthetic activity changes before obvious browning or foliage loss. A conventional greenness index may not capture these changes consistently.
These conditions can overlap, but they are not interchangeable stages in a universal sequence. A tree may recover from stress, and different causes can produce similar crown symptoms. Detecting a spectral anomaly does not establish the cause, the likelihood of recovery or the treatment required.
What NDVI Measures in a Forest
The Normalized Difference Vegetation Index compares near-infrared and red reflectance:
NDVI = (NIR − Red) / (NIR + Red)
Green foliage absorbs red light strongly and reflects near-infrared light. NDVI uses this contrast to describe vegetation greenness and aspects of canopy development. It is useful for tracking seasonal patterns and identifying departures from an expected condition.
However, NDVI does not directly measure a pathogen, insect infestation, water transport failure or tree survival. A high value does not prove that all trees within a pixel are healthy. A decline may reflect stress, foliage loss, management activity or a change in what the sensor sees beneath and between crowns.
Dense Canopies Can Hide Small Changes
In a closed forest canopy, red reflectance is already strongly reduced by foliage absorption. Additional leaf area, or modest changes within a dense crown, may produce relatively little movement in NDVI. This saturation limits its sensitivity to some canopy differences.
The operational consequence is important: a stable NDVI time series does not rule out early stress. It may mean that the change is too subtle, too localized or insufficiently expressed in the red and near-infrared bands.
Shadows Complicate Comparisons
Forest imagery contains sunlit crowns, shaded foliage, crown gaps and terrain shadows. Their proportions change with illumination and viewing geometry. NDVI’s ratio can reduce some illumination effects, but it does not make all observations directly comparable.
Nor does switching to red-edge measurements automatically solve the problem. A 2019 study in Remote Sensing examined two conifer species using UAV hyperspectral imagery. Red-edge slope and reflectance varied with illuminated and shaded canopy proportions, while NDVI was comparatively stable under the conditions tested. The finding supports checking illumination effects before interpreting spectral differences as biological change; it does not establish that either approach is universally superior.
A Pixel Can Contain Several Different Conditions
A satellite pixel may combine healthy crowns, a declining tree, understory vegetation, soil and shadow. A small affected crown can contribute too little to change the combined signal clearly. Green understory can also partly mask the loss of foliage above it.
Sentinel-2 illustrates the trade-off between spectral information and spatial detail: its red and broad near-infrared bands are available at 10-meter resolution, while its red-edge and shortwave-infrared bands are available at 20 meters. Resampling a 20-meter band onto a 10-meter grid does not create additional crown detail.
Choose imagery around the size of the expected affected patch, rather than the property boundary alone. A large forest estate can contain problems involving only a few trees.
When Are NDRE, EVI and Other Measurements Worth Testing?
Alternative measurements are worth testing when they address a defined limitation or a plausible stress response. Their value should be assessed against field observations and the decisions managers need to make.
- NDRE and other red-edge indices: useful candidates when pigment-related changes are relevant and NDVI provides limited contrast. Performance depends on the chosen wavelengths, sensor characteristics, forest structure and illumination. An NDRE value from one sensor should not automatically be treated as equivalent to another.
- EVI: worth comparing in dense vegetation because it was designed to reduce some background and atmospheric effects and improve sensitivity under high vegetation cover. It remains a canopy indicator and does not identify a stress agent.
- NDMI and other shortwave-infrared measurements: can add information related to vegetation water content. They do not directly establish root-zone moisture or distinguish drought from every other cause of canopy change.
- Thermal measurements: may add evidence relevant to water stress, but interpretation requires attention to weather, illumination, canopy structure and measurement scale.
- Hyperspectral imagery: provides narrower spectral sampling for investigating subtle differences. Its additional information is most useful when there is a specific biological hypothesis, suitable calibration and enough reference observations to test it.
Before commissioning a more complex sensor, define what improvement would justify it: fewer missed affected crowns, fewer unnecessary inspections or an earlier confirmed warning. More spectral bands alone do not demonstrate that improvement.
What a Controlled Pine Trial Actually Demonstrated
A 2018 study in Remote Sensing compared UAV multispectral imagery with RapidEye satellite imagery in a mature radiata pine plantation in New Zealand. Researchers induced stress by injecting herbicide into selected trees and monitored the response through time.
Under those experimental conditions, UAV imagery detected changes at individual-tree scale, whereas the satellite imagery detected affected clusters of four or more trees. Resampling the UAV data showed that spatial resolution alone did not explain the performance difference: index suitability also depended on the sensor.
That result supports combining platforms at different scales. It does not establish a universal four-tree detection threshold, prove disease-specific detection or justify a guaranteed warning period before browning. Herbicide-induced stress is a controlled experimental treatment, and its progression cannot simply be transferred to drought, root disease or insect attack.
Satellite Screening, Drone Review and Field Diagnosis
Satellites provide repeated coverage for screening stands. They can help locate persistent departures from seasonal behavior and show whether an anomaly is isolated, spreading or part of a wider regional pattern. Cloud cover and image quality determine when usable optical observations are actually available.
Drones provide detail for reviewing crowns. Targeted flights can help separate discoloration, thinning foliage, exposed branches and crown gaps. Multispectral surveys require consistent acquisition and reflectance calibration; higher spatial resolution also reveals more shadows and non-foliage material that must be handled during analysis.
Ground inspections provide evidence about the cause. Inspectors can examine foliage, bark, stems, roots and local soil conditions, and collect samples where necessary. Aerial imagery cannot substitute for these observations when deciding whether a particular pest, pathogen or site condition is responsible.
Canopy removal is a separate monitoring question. Our article on detecting selective logging explains how gaps and access routes contribute evidence of disturbance. Monitoring stress in standing trees requires closer attention to crown condition and its progression.
From an Anomaly to an Inspection Decision
A Practical Workflow: Seasonal Baseline to Field Records
1. Establish a Seasonal Baseline
Group comparable stands by species, age, canopy structure and site conditions. Use quality-controlled historical imagery to describe expected seasonal behavior and its variability. Include management history and weather context. Where historical coverage is limited, treat the initial baseline as provisional.
2. Identify Persistent Anomalies
Compare new observations with the expected seasonal range and suitable reference stands. Check clouds, shadows, image alignment and sensor consistency before interpreting a change. Persistence across usable observations can strengthen an alert, but the confirmation rule should reflect local risk: a rapidly developing problem may require immediate inspection rather than waiting for another satellite image.
3. Define Areas for Closer Review
Turn credible anomalies into mapped inspection areas with observation dates, affected extent, supporting imagery and uncertainty. Prioritize using the anomaly’s progression, site history and consequences of delayed action. Select drone coverage or direct field visits according to the detail needed and accessibility.
4. Record Findings and Follow Up
Record tree or plot locations, species, crown discoloration, foliage loss, stem and bark symptoms, site conditions, photographs and any diagnostic samples. Keep suspected causes separate from confirmed diagnoses. Include apparently unaffected reference areas and some non-alerted locations so evaluation can reveal false alerts and missed cases.
Continue observations after inspection or intervention. These records allow managers to test whether an alert was useful and refine the monitoring approach.
How Much Earlier Can Stress Be Detected?
There is no single lead time or accuracy figure that applies across forests. A defensible claim must identify the species, stress agent, sensor, observation schedule, reference measurements and validation method. It must also define “earlier”: before visible discoloration, before substantial defoliation and before mortality are different endpoints.
For a local pilot, record the first credible image anomaly and the first confirmed field symptom, along with gaps between observations. Evaluate false alerts and missed affected trees or stands using independent reference data. An accuracy score for classifying brown crowns cannot establish performance for detecting stress before browning.
The immediate operational benefit may be a better inspection route: a documented list of stands or crowns that deserve attention, with evidence explaining why.
Build Monitoring Around the Inspection Decision
STARPATH GLOBAL’s environmental monitoring solutions combine satellite observations with drone verification for forest assessment. The monitoring design can match image resolution, spectral coverage and acquisition timing to the affected areas managers need to investigate.
To assess a practical starting point, ask our team about your forest’s species, typical crown size, suspected stress and available field records. Those details help determine whether existing imagery can support useful screening and what a local validation pilot should measure.
Top image: Quantifying Tree Loss in Sierra National Forest (2013 – 2015)