Yes, satellite imagery can estimate shallow-water depth where enough light reaches the bottom and returns to the sensor. This approach, known as satellite-derived bathymetry (SDB), can help map coastal shallows, identify possible shoals and prioritize areas for detailed surveys. Its usefulness depends on water clarity, bottom conditions, image quality and validation against reliable depth measurements.
The important distinction is between identifying patterns that may indicate relative depth and producing calibrated estimates in meters. A darker patch is not automatically deeper water, and a detailed depth map is not automatically suitable for navigation.
How Optical Satellite Bathymetry Works
Multispectral satellites record reflected sunlight in different wavelength bands. In shallow water, part of that light has traveled through the water column, reflected from the bottom and returned toward the sensor. As the light travels, absorption and scattering weaken the signal. Different wavelengths are affected differently, allowing suitable combinations of bands to provide information about depth.
However, the recorded signal also depends on the bottom’s reflectance, material in the water, atmospheric effects and reflections from the surface. Bright sand and dark seagrass at the same depth can look very different. Suspended sediment can obscure the bottom even where the water is physically shallow.
For this reason, “optically shallow” means that the bottom contributes a detectable signal. It does not describe a universal depth range. There is no single maximum mapping depth or accuracy that applies to every coastline.
Which Water Conditions Are Suitable?
Before selecting an algorithm, assess whether the imagery contains enough information to support the intended depth estimate.
Water clarity should therefore be part of image selection, rather than a condition checked after modeling. Our article on satellite-derived turbidity explains why water color, turbidity and transparency need separate interpretation.
Use Analytical Bands, Not a Display Image
A true-color image is useful for inspecting coastlines, clouds, sediment plumes and surface disturbance. A rendered RGB product, however, may contain stretched, clipped or otherwise transformed values intended for display. Those values should not be substituted for the spectral measurements required by a quantitative model.
Use the original analytical bands and verify their identities. For Sentinel-2, B02 is blue, B03 is green and B04 is red. Also check the processing level, reflectance definition, spatial alignment, no-data values and any scale factors or offsets.
For native Sentinel-2 Level-2A products with the relevant metadata, surface reflectance is recovered using:
Reflectance = (DN + BOA_ADD_OFFSET) / QUANTIFICATION_VALUE
Use the values specified for the product and band. Some distribution platforms already apply these adjustments or provide harmonized data, so applying them again would introduce an error. The integer storage range does not by itself define the physical reflectance range.
Atmospheric correction also needs to suit the aquatic analysis. A product described as surface reflectance is not automatically equivalent to the water-leaving or remote-sensing reflectance expected by a particular method. Confirm the required input quantity before applying published coefficients.
Relative Depth, Empirical Models and Physical Inversion
A spectral index may reveal patterns consistent with shallower and deeper water. Without an established relationship to reference depths, it remains a relative indicator rather than a validated measurement in meters.
Empirical methods fit a relationship between spectral variables and known depths. These include band-ratio models, multiband regression and machine-learning approaches. They depend on reference observations that represent the depths, bottom types and water conditions where the model will be applied.
Physics-based methods model how light travels through the atmosphere and water and reflects from the bottom. They can estimate depth alongside other optical properties, sometimes without local depth points for model fitting. They still rely on assumptions and constraints, and independent depth measurements remain necessary to demonstrate local accuracy.
A 2024 study in Remote Sensing illustrates this approach using Landsat OLI imagery over Guam, Key West and Puerto Rico. Its workflow accounted for atmospheric and surface effects, water optical properties and bottom reflectance, then compared retrieved depths with airborne LiDAR. The study also showed why assumptions about local bottom reflectance matter.
A Public Case with Separate Calibration and Validation
A 2019 study in Estuarine, Coastal and Shelf Science provides a useful example from South Florida. Caballero and Stumpf processed Sentinel-2A/B imagery with ACOLITE and applied a ratio-transform bathymetry model. Vertical calibration used five to ten points from digital charts, while separate LiDAR surveys supported validation and error analysis.
Under low-turbidity conditions, the reported median absolute errors were 0.50 m in West Palm Beach over a reference depth range of 0–18 m, 0.40 m in Key West over 0–5 m, and 0.22 m in Dry Tortugas over 0–6 m.
These are site-specific results, not a general Sentinel-2 accuracy specification. The depth ranges describe the evaluated reference coverage, and median absolute error is not a maximum error or a guarantee for every pixel. The study’s small calibration set should not be treated as a universal sampling recommendation.
Match Depth Measurements, Dates and Vertical References
A reliable comparison requires more than placing survey points over a satellite raster. The observations must describe compatible locations, surfaces and reference levels.
- Define the output. Specify whether the product reports water depth below the surface at acquisition time or bottom elevation relative to a named vertical datum. Record units and the positive-depth or elevation convention.
- Reconcile vertical references. Survey soundings, chart depths, GNSS heights and satellite estimates may use different reference surfaces. Changing an elevation’s sign does not transform its datum. Document water-level adjustments and any datum transformation, including their uncertainty.
- Check temporal compatibility. Collect reference measurements close to the image date where possible. In mobile sandbanks, dredged channels or storm-affected areas, older surveys may describe a different bottom. Tide correction cannot compensate for actual seabed change.
- Check spatial compatibility. Verify image positioning and survey coordinates. A point sounding and a satellite pixel represent different spatial supports, particularly on steep slopes or near small features. Document how soundings are matched or aggregated to pixels.
- Separate calibration from validation. Reserve measurements that are not used to fit coefficients or select the final model. Holding out survey lines or geographic blocks can provide a more demanding test than randomly splitting neighboring points.
Reference coverage should include the conditions that matter to the customer. A model calibrated on bright sandy shallows has not demonstrated performance over dark reef patches or deeper channels simply because it produces values there.
What NOAA’s Shoal Investigation Demonstrates
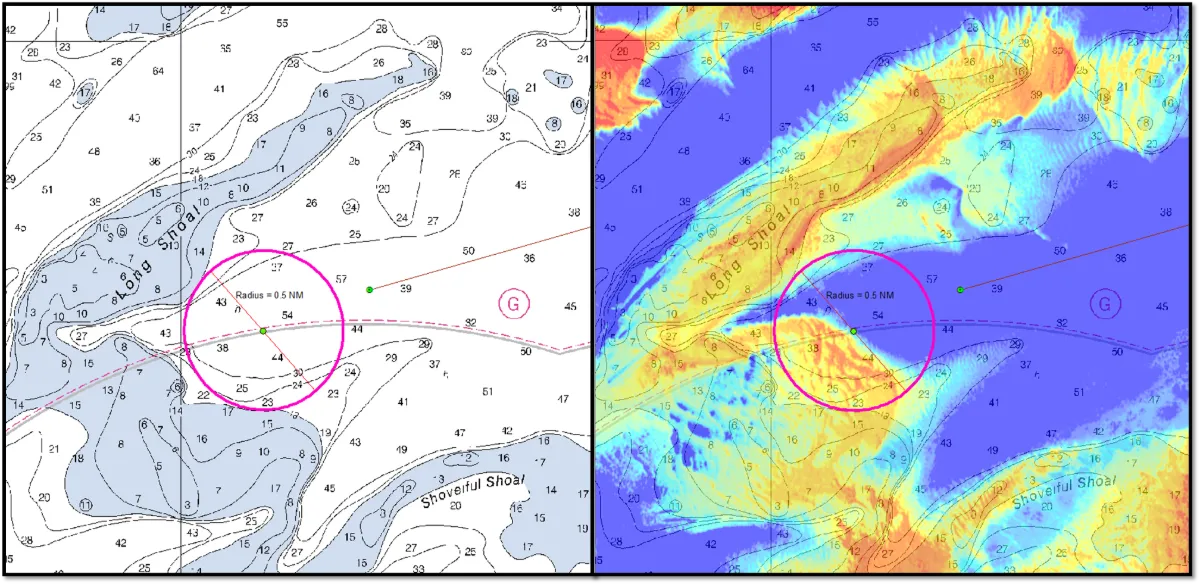
NOAA’s Office of Coast Survey reported a practical investigation in Nantucket Sound in 2015. Satellite-derived imagery indicated possible shifted shoals, helping the crew of NOAA Ship Thomas Jefferson plan follow-up measurements. Survey launches collected multibeam data, while smaller Z-boats acquired vertical-beam soundings in shallower areas.
The investigation connected an image-based indication with direct acoustic observations. It demonstrated the value of SDB for locating areas that deserved closer examination and directing survey effort. The account also identified cloud cover, turbidity, chlorophyll and other water properties as limitations.
That operational example should be distinguished from a formal independent accuracy assessment. It supports the value of satellite screening; it does not establish a universal numerical error bound.
Deliver the Valid Area and the Error Alongside the Depth Map
A useful bathymetry deliverable should make its limits visible. At minimum, it should include:
- Depth or bottom-elevation raster: units, vertical datum, sign convention, pixel size, acquisition date and processing method.
- Validity mask: usable areas and exclusions for clouds, glint, breaking waves, inadequate bottom signal or other retrieval failures. Invalid areas should remain no data.
- Independent validation: reference source and date, sample count, spatial coverage, evaluated depth range, signed bias and error measures such as MAE or RMSE.
- Performance by condition: errors across relevant depth intervals, bottom types and geographic areas, rather than only one pooled statistic.
- Uncertainty information: a documented uncertainty layer where supported by evidence. A single overall RMSE should not be presented as a validated uncertainty estimate for every pixel.
- Recommended follow-up: areas requiring sonar, bathymetric LiDAR or other measurements before the intended decision can be made.
Pixel size is also different from feature-detection capability. A 10 m raster does not establish that every narrow channel, isolated rock or small shoal has been detected. Likewise, a difference between two depth maps needs to exceed the combined effects of retrieval error, water-level uncertainty and image misalignment before it can be interpreted as seabed change.
When Additional Surveying Is Needed
Sonar is needed where water is too deep or turbid for a usable bottom signal, or where the task requires more complete characterization of depths and hazards. Bathymetric LiDAR can complement optical imagery in suitable clear-water conditions, but also has water-clarity limitations.
For navigation, dredging acceptance, under-keel clearance or engineering design, the survey approach must meet the applicable accuracy, coverage and feature-detection requirements. A satellite depth estimate should not be treated as a navigation-ready nautical chart merely because it has been calibrated.
For coastal planning and environmental assessment, SDB can still provide valuable coverage and help direct more detailed measurements. Within a broader maritime analysis workflow, the first step is to establish which areas are observable and what validation the decision requires.
STARPATH GLOBAL integrates global satellite resources with data processing and analysis. To assess whether shallow-water imagery can support your project, share the area, intended use and available survey data with our team. These inputs provide the basis for defining a feasible analysis and the measurements needed to verify it.
Top image: Side-by-side picture of the chart and SDB imagery for the intended anchorage location in Nantucket Sound. SDB imagery indicated a shoal that covered half of the anchorage safety circle. A Z-boat verified the indicated shoal was almost 30 ft shoaler than charted and without this useful imagery, the ship and launches could have run aground.