A flood map may show water across an open field while leaving the neighboring streets unmarked. For an emergency team, that blank space raises a critical question: is the street dry, or could the satellite simply not see the water?
Synthetic aperture radar (SAR) can observe through clouds and at night, making it valuable during storms. Yet the familiar rule that “floodwater looks dark” works best where the radar has a clear view of a smooth, open water surface. In a city, the same flood can produce bright returns, dark radar shadows, or little detectable change. A reliable response map must show where the observation is uncertain and direct attention to the evidence needed to resolve it.
Why the dark-pixel method breaks down between buildings
Over open ground, a smooth water surface usually reflects much of the radar signal away from the satellite. The return becomes weaker, so newly flooded land often appears darker than it did before the event. Comparing images acquired before and during the flood helps separate new inundation from permanent rivers and lakes.
Buildings change the geometry. Because SAR views the ground from the side, a tall structure can hide the street behind it in radar shadow. In other locations, a signal can reflect between floodwater and a building wall before returning to the satellite. This double-bounce effect can make a flooded area brighter. Building orientation, road surfaces and the radar viewing direction all affect the result. Even a dark street is ambiguous: asphalt or persistent shadow can look dark when no floodwater is present.
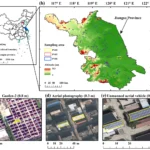
A 2019 study in Remote Sensing, using Sentinel-1 observations and airborne imagery from flooding in Lumberton, North Carolina, found a mixture of increasing, decreasing and nearly unchanged radar returns in urban flooded areas. A single brightness threshold therefore cannot serve as a dependable citywide flood test.
First, map where SAR has a poor view
Before interpreting unmarked streets as dry, analysts should overlay building footprints or height data, inspect the radar look direction, and identify likely shadow and layover zones. Dense blocks and narrow streets deserve particular attention. A pre-flood SAR image also helps reveal surfaces that were already dark or bright under comparable observation conditions.
These checks produce an observation-confidence layer. Where buildings obscure the ground or the return is ambiguous, the appropriate label is “low confidence” or “no reliable observation”—not “unflooded.” A change in radar brightness can strengthen an interpretation, but it still needs to be assessed alongside the local geometry and other evidence.
Valencia: keep mapped water separate from potentially affected buildings
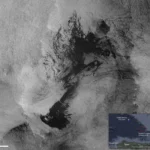
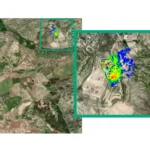
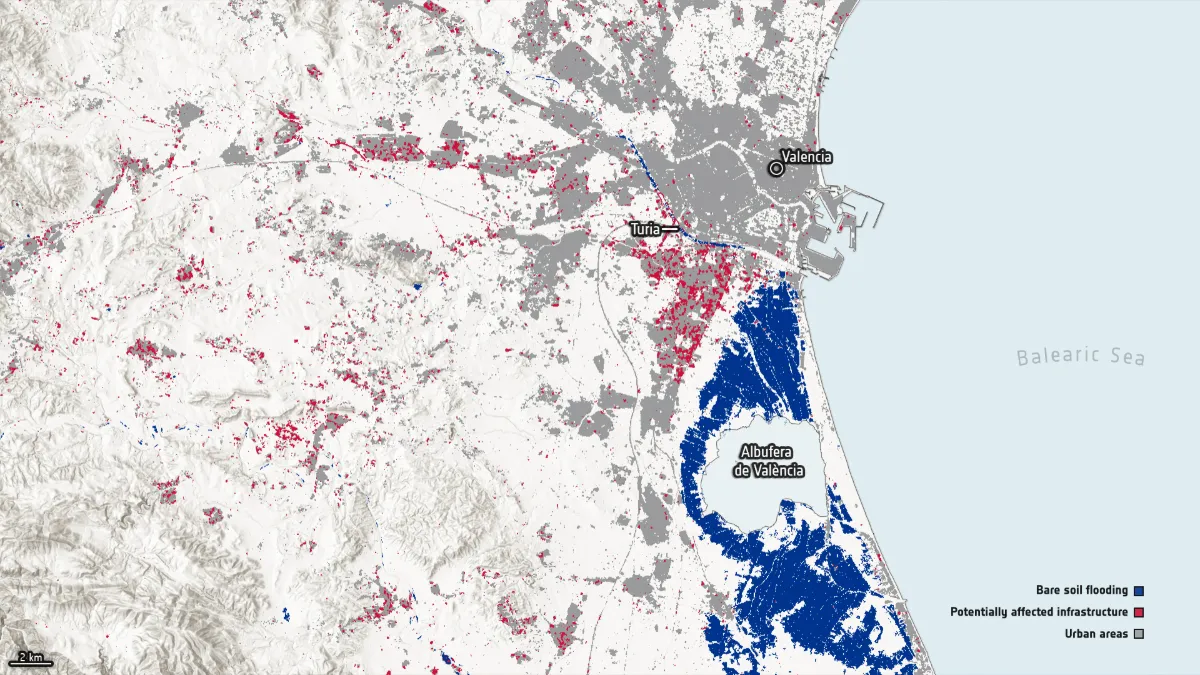
ESA published a map produced with the Luxembourg Institute of Science and Technology (LIST) after the October 2024 floods around Valencia, Spain. Its Sentinel-1 observation was acquired on 31 October and compared with a 19 October reference. The map distinguishes inundation detected over open ground from potentially flood-affected urban infrastructure. LIST used separate flood-mapping approaches for the open-ground and urban results.
That distinction matters operationally. A marked urban area indicates a reason to investigate potential exposure; it does not establish that every building inside it flooded, or reveal water depth indoors. Conversely, a street without a flood symbol is not automatically safe if the radar view was obstructed. The 31 October acquisition is also a snapshot, not a record of the flood’s maximum extent at every location.
How to fill the gaps without hiding uncertainty
These layers answer different questions. A hydraulic model can indicate where water may flow and estimate depth under its input assumptions; a SAR image records radar conditions at its acquisition time; a field report describes a particular place and time. Agreement increases confidence, while disagreement calls for investigation. Optical imagery taken after the water recedes cannot, by itself, reconstruct the peak. For a broader discussion of gaps in long-term satellite flood records, see STARPATH GLOBAL’s article on Sentinel-1 flood monitoring.
What should an emergency flood map show?
A useful delivery separates three categories:
- Observed flooding: water supported by the event imagery and quality checks at the stated acquisition time.
- Potentially flooded—verify: areas where SAR changes, nearby flooding, terrain or other evidence warrant follow-up, but direct confirmation is insufficient.
- No reliable observation: streets or blocks obscured by radar geometry, affected by ambiguous returns, outside usable coverage or lacking suitable event imagery.
The map should display the satellite acquisition time, the date of the pre-flood comparison, the data used for each category and the areas awaiting verification. Teams can then prioritize inspections without mistaking a monitoring gap for evidence of safety. A mapped surface-water boundary should never be converted directly into a building’s interior flood depth.
For cities and water-infrastructure operators, STARPATH GLOBAL combines satellite observations with terrain and ground information to support flood-risk assessment and follow-up. Explore our water infrastructure solution, or talk to our team about a map that makes its observation limits clear.
Feature image: ESA/LIST’s Sentinel-1-derived map of flooding around Valencia, Spain, based on the 31 October 2024 observation. The map distinguishes detected inundation over open ground from potentially flood-affected urban infrastructure; the latter is not a confirmed map of flooded buildings. Credit: Contains modified Copernicus Sentinel data (2024), produced by ESA/LIST.