A solar farm, a rooftop array and a single photovoltaic (PV) module are three different mapping targets. A satellite image may show where a large solar farm is located without resolving the gaps between its rows. It may reveal a rooftop array without showing how many modules it contains. Before choosing imagery, a utility or city team needs to decide which of those answers its asset inventory requires.
What Does “Identify a Solar Panel” Mean?
For a citywide inventory, the useful first result is often a list of buildings with likely rooftop PV installations. A more detailed project might need an outline for each array and an estimate of its visible area. Counting individual modules is a finer task: the image must show the boundaries between adjacent units clearly enough for a reviewer to separate them.
These outputs should not be treated as interchangeable. A detected array is evidence of a likely installation at the image acquisition date. It does not, by itself, establish the number of modules, their rated capacity, their electricity generation or their condition.
How Much Detail Does Each Image Show?
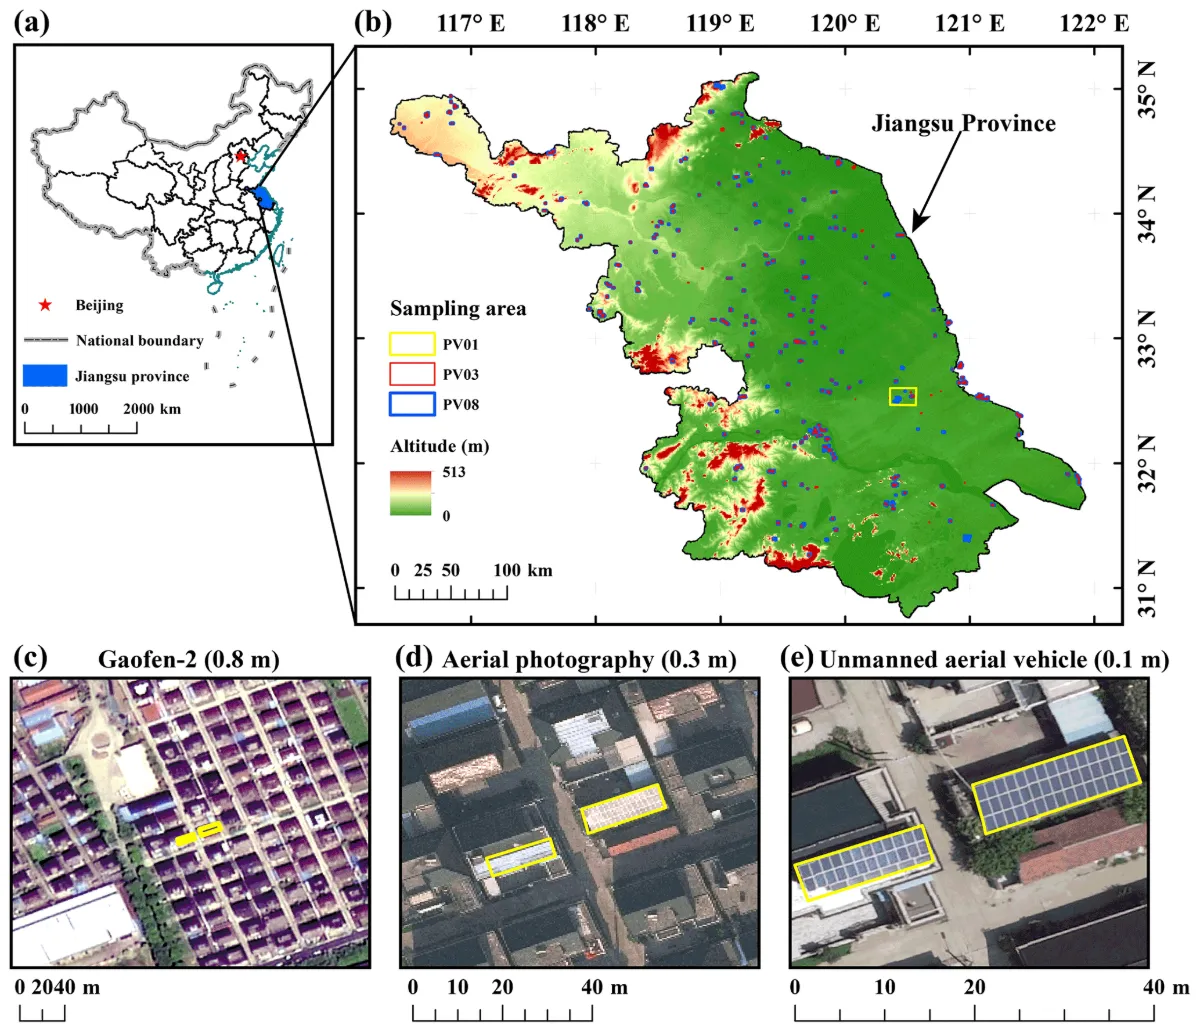
A 2021 study in Earth System Science Data provides a particularly useful comparison. Its Figure 1 shows the same rooftop PV installations in a 0.8 m satellite image, a 0.3 m aerial photograph and a 0.1 m UAV image. In the satellite view, the installations occupy only a small number of pixels mixed with the surrounding roofs. Their presence is easier to judge in the aerial view, although precise boundaries remain difficult. In the UAV view, the researchers could distinguish the installations, trace their boundaries and count their constituent panels.
At the coarser end, a study of PV sites in Vietnam using 10 m Sentinel-2 imagery detected solar sites and even some urban rooftop PV clusters. Its authors also found that the gaps between rows visible in higher-resolution reference imagery were missing from the 10 m result. Detection of a site or cluster at that scale does not amount to reliable identification of individual rooftop modules.
Why Zooming In Does Not Solve the Problem
A 10 m pixel records light from an area roughly 10 m by 10 m on the ground. A small rooftop installation can occupy only part of that area, mixed with roof, shade and other objects. Enlarging the image makes the pixels bigger on screen; it does not create a measurement of each module inside them.
Super-resolution software can produce a sharper-looking image by predicting plausible detail. That prediction may help a trained model with a specific, validated task, but an apparent line between modules is not independent evidence that the original sensor observed that line. If a contract requires module-level positions or counts, use imagery in which those features can actually be checked.
Where Do Inventory Errors Come From?
Small arrays can be missed when their outlines blend into a roof or fall in shadow. Dark roofing, skylights, solar water-heating equipment and other rooftop features can also resemble PV in an overhead image. A detector trained on one city’s buildings may perform differently on another city’s roof materials and installation patterns.
The Jiang study illustrates the trade-off in its segmentation results: some predicted PV areas omitted parts of real installations, while other models marked visually similar background areas as PV. The researchers also found that models trained at one image resolution could not simply be applied at another without adaptation. Separately, a 2022 study in Applied Energy cautioned that PV detection performance can appear overly optimistic when validation does not adequately represent the places and records where a system will be used. Neither study’s reported accuracy is a performance promise for a new city.
A Practical Workflow for a Citywide Rooftop PV Inventory
- Define the inventory unit. Decide whether the deliverable is a building with likely PV, an individual array, visible array area or a verified module count. Record the required image date and geographic coverage.
- Select imagery against the smallest target. Inspect sample neighborhoods before buying or processing citywide coverage. Check the native resolution, acquisition date, shadows, haze, viewing geometry and whether the imagery can be used for the intended analysis.
- Prepare roof boundaries. Align building footprints with the image and account for roof overhangs and positional error. Keep ground-mounted arrays and carports in separate categories if they matter to the inventory.
- Detect candidates. Use visual interpretation or a locally trained model to flag likely PV within roof areas. Preserve confidence scores and an “uncertain” class instead of forcing every dark roof feature into a yes-or-no result.
- Review and validate. Check a representative sample of both detected and undetected roofs, including different roof materials, building sizes and neighborhoods. Report false detections and missed installations at the same level—building, array or module—as the intended deliverable.
- Compare with asset records. Match reviewed candidates to installation or interconnection records using address, roof location and dates. Investigate mismatches: an image may predate an installation, while a registry can contain an outdated address or an installation absent from the image.
The resulting inventory should retain the image date, source, review status and uncertainty for each entry. Visible array area is useful for screening and planning, but installed capacity needs module specifications and layout information. Actual generation requires operational or modeled inputs; component health requires an inspection method suited to diagnosing faults. For the separate task of monitoring large ground-mounted facilities, see solar farm monitoring overview.
STARPATH GLOBAL can help utilities and city teams choose imagery that matches their inventory target, then design a reviewable detection and validation workflow. To assess coverage and the appropriate level of detail for your area, contact our team.
Feature image: from Jiang et al., Earth System Science Data (2021). Map of the study area and data sources. (a) The location of Jiangsu Province; (b) spatial distribution of all sampling areas; (c) Gaofen-2 satellite image with a spatial resolution of 0.8 m; (d) image from aerial photography with a spatial resolution of 0.3 m; and (e) image from unmanned aerial vehicle with a spatial resolution of 0.1 m. The yellow boxes in panels (c–e) represent the same rooftop PVs.