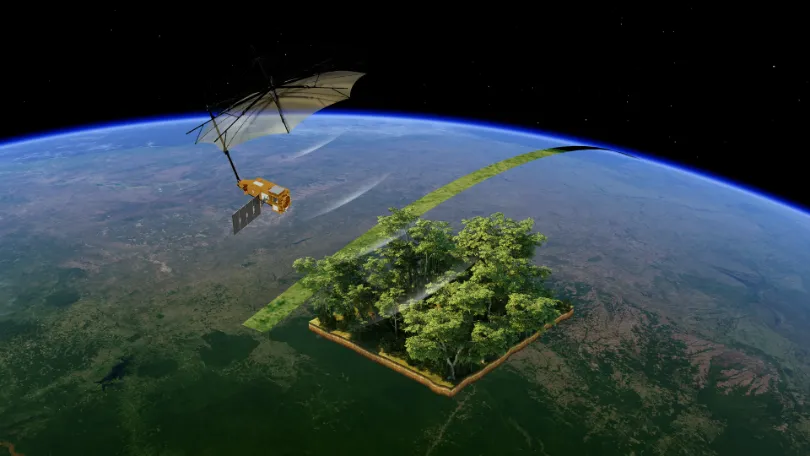
As the world continues to pursue net-zero targets, carbon data is becoming an increasingly important foundation for climate governance, corporate emissions reduction, and ecosystem management.
Countries need to quantify and assess greenhouse gas emissions more accurately. Companies need an ongoing understanding of emissions changes across their operations and associated facilities. Carbon markets and carbon projects increasingly require credible monitoring evidence. At the same time, forests, grasslands, farmland, and wetlands continue to absorb and store carbon, but their capacity to function as carbon sinks can change in response to land-use change, drought, wildfire, and other disturbances.
The questions that need to be answered therefore extend far beyond “How much was emitted?” , They also include:
Where are greenhouse gases present? Where might they have come from? How are they transported through the atmosphere? Which ecosystems are absorbing and storing carbon? How are these carbon sources and sinks changing over time?
Energy consumption statistics, corporate reporting, emission factors, resource inventories, field plots, and ecological models remain essential to carbon accounting. However, they have limitations when applied to large, continuously changing, or remote areas. Satellite remote sensing adds a wide-area, repeatable, and spatially explicit observation layer, providing long-term measurements from space for both emissions and carbon sink monitoring.
No single satellite, however, can provide a complete view of the carbon cycle. Greenhouse gas concentrations, emitting activities, atmospheric transport, forest structure, and ecosystem change are different observation targets. Monitoring them requires a combination of greenhouse gas spectroscopy, optical imagery, hyperspectral sensing, radar, lidar, and meteorological observations.
Different carbon monitoring objectives require different sensors, spatial resolutions, and observation frequencies. Explore satellite imagery and Earth observation data capabilities.
How Satellites Monitor Carbon Emissions
Satellite-based emissions monitoring needs to answer three interconnected questions: How are atmospheric carbon dioxide and methane concentrations changing? Where might an observed anomaly have originated? How are greenhouse gases transported through the atmosphere?
Greenhouse Gas Spectroscopy Missions: Building the Atmospheric Concentration Picture
Greenhouse gas monitoring satellites measure the absorption of light by atmospheric gases at specific wavelengths to retrieve CO₂ or CH₄ concentrations. OCO-2, OCO-3 and TanSat primarily observe carbon dioxide; GOSAT observes carbon dioxide and methane; and Sentinel-5P provides methane and other atmospheric-composition observations.
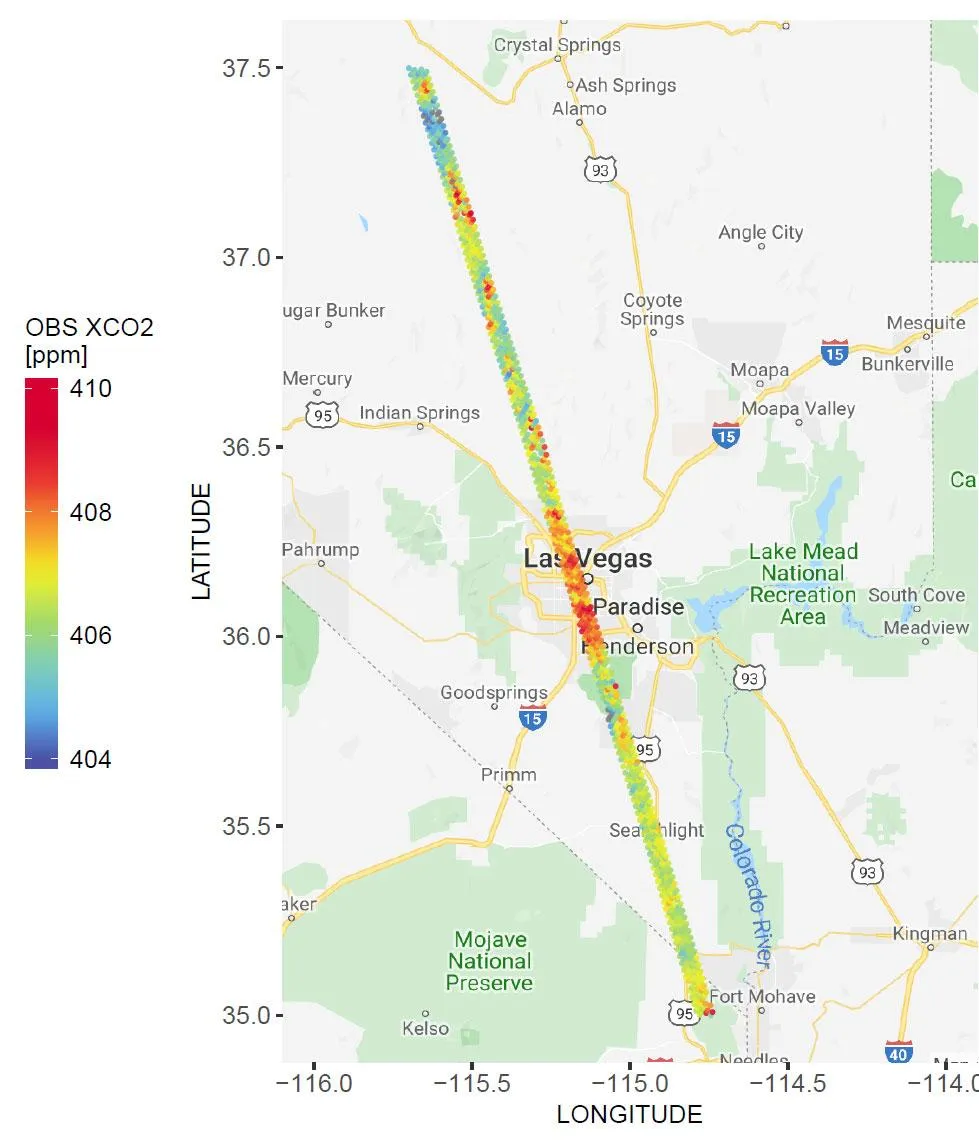
OCO-2 measurements of atmospheric CO₂ over Las Vegas. Warmer colors indicate higher column concentrations. Credit: NASA
These missions provide observations that can be used to characterize global and regional concentration patterns, detect sufficiently large concentration enhancements, and track seasonal and long-term changes. When satellite observations are combined with atmospheric transport models, they can also support research into fossil fuel emissions, seasonal vegetation uptake, and the effects of extreme climate events on the carbon cycle.
Launched in 2016, TanSat gave China an independent capability to collect global atmospheric CO₂ concentration data. It has also become an important data source for regional and global carbon flux research.
Concentration, however, is not the same as emissions. Emissions of the same magnitude can produce very different concentration signals under different wind and boundary-layer conditions. Industrial activity, transportation, vegetation uptake, soil respiration, and transport from upwind areas may all influence an observed result.
Most greenhouse gas spectroscopy missions also use passive remote sensing, relying on reflected sunlight. Their observations can therefore be limited by nighttime conditions, high-latitude winters, cloud cover, aerosols, and surface reflectance.
These satellites primarily build a spatial picture of atmospheric carbon. Converting concentration measurements into estimates of emission quantities and sources requires additional observations and analytical methods.
Optical, Hyperspectral, and Thermal Infrared Satellites: Identifying Potential Emitting Activities
Greenhouse gas satellites can help answer where an atmospheric anomaly has appeared. Determining where it may have originated also requires an understanding of what is happening on the ground.
High-resolution optical imagery can identify power plants, steel mills, cement plants, chemical industrial parks, mines, oil and gas facilities, storage tanks, and visible pipeline corridors or associated surface infrastructure. It can also reveal facility expansion, shutdowns, and land disturbance.
Hyperspectral data can distinguish more detailed spectral characteristics and, under suitable observation conditions, identify certain methane enhancement signals. Thermal infrared data can detect active fires, gas flaring, and industrial heat anomalies.
China’s GF-5-02 hyperspectral data has been used in research to detect and quantify large methane plumes from coal-mining and oil-and-gas facilities under suitable observation conditions. Combining hyperspectral observations with high-resolution imagery, facility locations, and meteorological information can help connect an isolated concentration enhancement with potential emitting activities.
These satellites may not directly measure carbon dioxide, but they can help answer a crucial question: Are there facilities or activities near a greenhouse gas anomaly that could be contributing to emissions?
For energy and industrial companies managing large numbers of geographically dispersed assets, multi-source satellite data can narrow the scope of field investigations and direct limited inspection and maintenance resources toward the areas most in need of attention. Learn how satellite data can support oil and gas facilities and wide-area asset monitoring.
Meteorological Satellites and Atmospheric Models: Explaining Greenhouse Gas Transport
Greenhouse gases are transported by the wind. A concentration enhancement does not necessarily originate directly beneath the satellite observation point. It may result from emissions released some distance away and subsequently transported through the atmosphere.
Wind direction, wind speed, temperature, boundary-layer height, and atmospheric stability all affect gas dispersion. Clouds and aerosols influence the quality of greenhouse gas remote sensing while also providing contextual information about atmospheric transport and pollution processes.
Meteorological satellites such as China’s Fengyun series, together with ground-based weather observations and atmospheric transport models, are therefore important components of emissions monitoring. Combining satellite observations with numerical weather data, atmospheric transport models, emissions inventories, facility information, and high-resolution surface imagery can help constrain the likely upwind source area and identify facilities that warrant further investigation.
A relatively complete monitoring chain can be summarized as:
Concentration anomaly detection → Atmospheric transport analysis → Potential facility matching → Field verification → Follow-up monitoring
Satellite observations cannot independently determine a company’s precise emissions or establish legal responsibility. They can, however, support wide-area screening, help prioritize investigations, and track changes after mitigation measures have been implemented.
Spaceborne CO₂ Lidar: Active Detection and Active-Passive Coordination
Spaceborne lidar is not limited to greenhouse gas monitoring. Depending on its wavelength, detection mechanism, and mission design, it can measure the vertical structure of clouds and aerosols, forest canopies, surface elevation, ice sheets, and wind fields.
For emissions monitoring, one of the most important developments is spaceborne integrated path differential absorption, or IPDA, lidar for actively measuring atmospheric CO₂ column concentrations.
Can a satellite detect CO₂ actively, without relying on reflected sunlight?
China’s DQ-1 and DQ-2 represent two of the most prominent in-orbit capabilities in this field.
Launched in 2022, DQ-1 carries the ACDL spaceborne atmospheric detection lidar. It uses IPDA technology to detect CO₂ actively. By comparing differences in CO₂ absorption across laser wavelengths, the instrument retrieves atmospheric CO₂ column concentrations while also collecting information about clouds and aerosols.
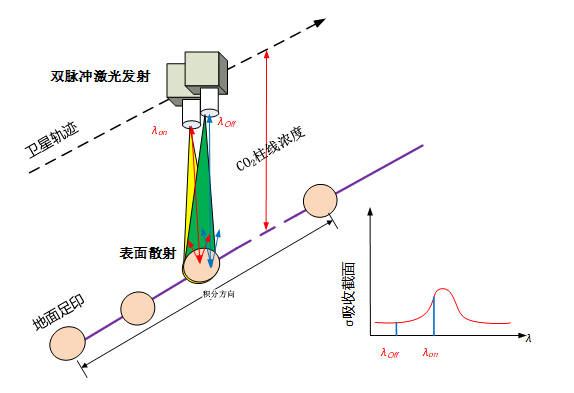
Principle of spaceborne IPDA lidar measurement of atmospheric CO₂ column concentrations. Source: Shanghai Institute of Optics and Fine Mechanics, Chinese Academy of Sciences.
According to the Shanghai Institute of Optics and Fine Mechanics of the Chinese Academy of Sciences, ACDL is the world’s first spaceborne lidar developed for carbon-dioxide detection and the first to conduct combined global measurements of CO₂ and aerosols. It enables coordinated observations of CO₂ column concentrations, clouds, and aerosols.
Unlike passive spectroscopy, active lidar provides its own light source. Because it carries its own light source, active lidar can operate during both day and night and provide valuable observations during polar night and other low-sunlight conditions. Thick clouds, however, can still prevent useful CO₂ column retrievals.
China’s High-Precision Greenhouse Gas Comprehensive Monitoring Satellite—sometimes referred to as DQ-2—was launched on April 17, 2026, marking a new stage in active-passive greenhouse-gas observation. According to China’s Ministry of Ecology and Environment, it is the world’s first satellite designed for coordinated active-passive greenhouse-gas observations. Its payloads include an atmospheric detection lidar, a wide-swath hyperspectral greenhouse gas monitor, infrared and ultraviolet hyperspectral atmospheric composition instruments, and a cloud and aerosol imager.
The active lidar is designed to provide day-and-night CO₂ observations along the satellite ground track. The wide-swath hyperspectral instrument is designed to expand the area covered by greenhouse-gas observations, while the other payloads provide complementary information on methane, atmospheric pollutants, clouds, and aerosols.
Used together, the two satellites could provide complementary active and passive observations of greenhouse gases, clouds, aerosols, and atmospheric composition. This does not mean that the two satellites can monitor every location continuously. Instead, it shows that China is progressing from a single active-detection satellite toward a greenhouse gas observing system that combines active and passive sensing, multiple payloads, and multiple satellites.
Active lidar cannot replace passive spectroscopy. Its measurements are typically distributed along the satellite track or collected within relatively narrow footprints, while thick clouds may still block laser transmission. A more complete technical approach combines the precision and complementary coverage of active measurements with the broader coverage of passive observations.
How Satellites Monitor Carbon Sinks
Carbon sink monitoring focuses on how much carbon is absorbed and stored by forests, grasslands, farmland, wetlands, and other ecosystems—and whether that capacity can be sustained over time.
Satellites usually do not provide a final carbon sink estimate directly. Instead, they observe indicators related to carbon storage and uptake, including forest cover, canopy structure, vegetation condition, wetland hydrology, fire, and land use. These observations are then combined with field plots, biomass equations, and ecological models to estimate carbon stocks and changes.
Optical Satellites: Monitoring Ecosystem Change
Multispectral optical satellites can provide long-term observations of forest cover, vegetation growth, afforestation, deforestation, burned areas, and land-use change.
Comparisons across different dates can show whether forest area has increased or decreased, whether ecological restoration has established stable vegetation, whether logging or land conversion has occurred within a project area, and whether grasslands, farmland, or wetlands are degrading.
China’s Gaofen and other Earth observation satellites can provide imagery at different spatial resolutions for these applications. For carbon sink projects, historical satellite data can also establish pre-project land-use and vegetation baselines against which subsequent changes can be assessed.
SAR and Vegetation Lidar: Estimating Forest Structure and Carbon Stocks
Forest area is not the same as forest carbon stock. Forests of the same size can differ substantially in tree height, age, canopy structure, and biomass.
Synthetic aperture radar, or SAR, emits microwave signals actively, does not depend on sunlight, and can observe through cloud cover. Radar backscatter is influenced by vegetation structure, surface roughness, and moisture conditions, making SAR useful for supplementing information on forest structure, biomass, soil moisture, and wetland inundation.
ESA’s Biomass satellite, launched in 2025, carries the first spaceborne P-band SAR system. It is designed to provide repeated and systematic estimates of global forest biomass and height, while supporting research into carbon stock changes associated with deforestation, forest degradation, and regrowth.
Vegetation lidar can measure forest canopy height and vertical structure, providing important constraints for aboveground biomass estimation. Combining lidar measurements with field plots, biomass equations, optical imagery, and SAR data can extend detailed structural observations across larger areas.
It is important to distinguish between two types of lidar in this context. The atmospheric detection lidars carried by DQ-1 and DQ-2 primarily measure carbon dioxide, clouds, and aerosols. Vegetation lidar, by contrast, primarily measures forests and surface structure.
Hyperspectral Observations and SIF: Tracking Changes in Vegetation Productivity
The amount of carbon already stored in an ecosystem is only part of the picture. How actively that ecosystem is taking up carbon also matters.
Drought, pests, soil degradation, and water stress can reduce vegetation productivity and may even turn an ecosystem from a carbon sink into a carbon source. Hyperspectral satellites can provide information on vegetation type, chlorophyll, water content, and stress, helping identify early changes that may be difficult to detect in conventional visible imagery.
Solar-induced chlorophyll fluorescence, or SIF, offers another way to observe photosynthetic activity. Plants emit a weak fluorescence signal when they absorb sunlight and perform photosynthesis. SIF does not directly measure how much CO₂ a plant has absorbed, but it is closely related to photosynthesis and ecosystem productivity.
By combining observations of forest cover, structure, biomass, hyperspectral characteristics, and SIF, carbon sink monitoring can progress from static questions—“Where is carbon stored, and how much is there?”—to a more dynamic one: “How is the ecosystem’s capacity to absorb carbon changing?”
Goumang: Building an Active-Passive Forest Carbon Sink Observing Capability
China’s Terrestrial Ecosystem Carbon Monitoring Satellite, known as Goumang, integrates observations of forest structure, biomass, and vegetation productivity on a single satellite platform.
Goumang carries a multi-beam lidar, a multi-angle multispectral camera, a hyperspectral imager, and a multi-angle polarization imager, forming a combined “point-and-area” and active-passive observation system.
Its lidar can measure forest height and vertical structure. Multispectral and polarization observations provide complementary information on vegetation cover and canopy characteristics, while the hyperspectral payload collects indicators related to vegetation productivity, including SIF.
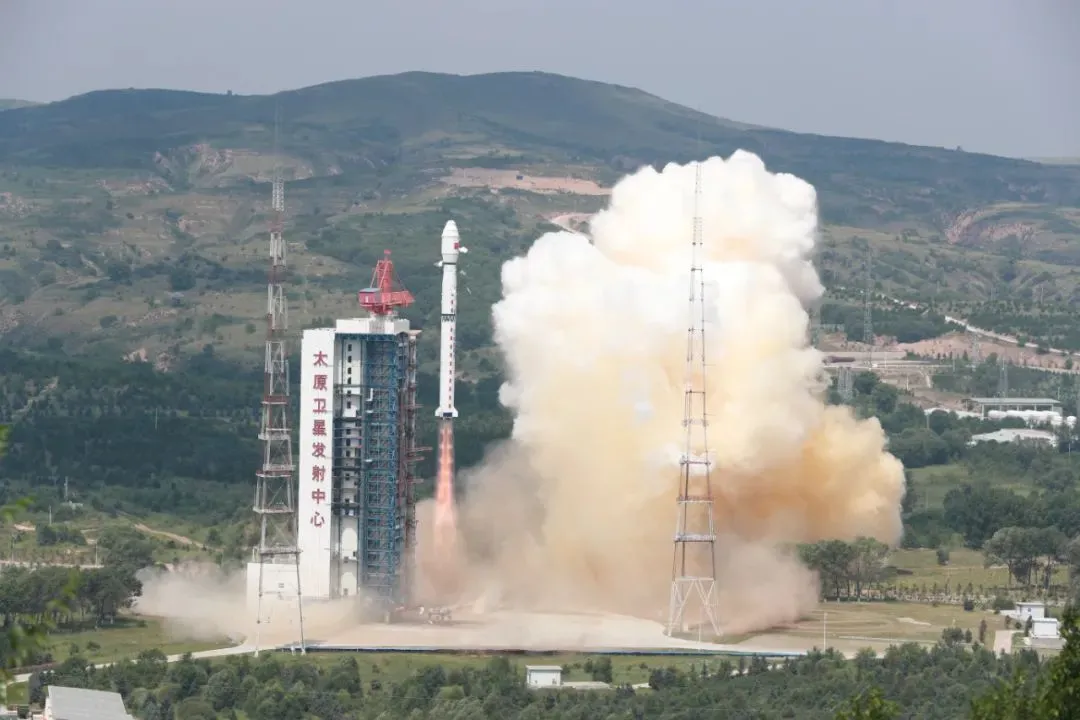
China’s Goumang satellite lifts off aboard a Long March 4B launch vehicle from the Taiyuan Satellite Launch Center on August 4, 2022. Credit: CNSA
In May 2026, China’s National Forestry and Grassland Administration announced that Goumang’s global daily SIF product had been released through the National Ecosystem Science Data Center and would receive routine updates. It supports ecosystem productivity assessment, terrestrial carbon sink monitoring, agricultural monitoring, and ecological disaster early warning. This represents a progression from inpidual scientific observations toward routine product publication and application services.
While DQ-1 primarily observes atmospheric CO₂ column concentrations and their spatial variation, Goumang examines forest structure, biomass, and vegetation productivity from the ecosystem side. Their observation targets differ, but together they cover two important ends of the carbon cycle: the atmosphere and terrestrial ecosystems.
For specific carbon sink projects, Goumang can be combined with other optical, SAR, and ground-based data to establish historical baselines, monitor forest structure and ecosystem change, and identify risks such as fire, logging, drought, and land conversion.
For long-term monitoring of forests, grasslands, wetlands, or ecological restoration areas, explore environmental monitoring solutions.
Satellite data cannot replace field plots or approved methodologies, nor can it independently determine how many carbon credits a project may issue. It can, however, add broader and more continuous spatial evidence to carbon sink measurement, reporting, and verification.
From Multi-Source Observations to Actionable Carbon Decisions
Different satellites provide different pieces of the carbon-cycle picture, but satellite data alone does not automatically add up to a regional carbon account. Assessing carbon sources, carbon sinks, and how they change requires satellite observations to be combined with meteorological data, facility information, ground measurements, emissions inventories, and models.
Turning satellite observations into action typically involves an iterative process:
Detection → analysis and attribution → ground validation → action → continued monitoring
With such a wide range of satellites and sensing technologies available, each project needs a fit-for-purpose combination of data sources, spatial resolution, and observation frequency—as well as a practical way to integrate the resulting insights into existing investigation, verification, and management workflows.
STARPATH GLOBAL’s Forward Deployed Engineer team starts with the specific problem a client needs to solve. The team evaluates available data, designs a multi-source observation approach, and uses pilot projects to determine whether satellite monitoring can identify anomalies earlier, reduce unnecessary field inspections, or provide continuing evidence of emissions reduction and ecosystem restoration outcomes.
For qualifying government agencies, companies, and project teams, the Pioneer Partner Program provides a free preliminary value assessment and qualifying on-site engineering support. No formal procurement commitment is required until the pilot has demonstrated expected operational value and potential return on investment.
If you manage geographically dispersed industrial assets, conduct greenhouse gas verification, or need long-term monitoring of forests, wetlands, or other ecological projects, you can apply for a STARPATH GLOBAL Pioneer FDE value assessment.
From atmospheric greenhouse gases to ecosystem carbon sinks, STARPATH GLOBAL connects observations from different satellites and transforms them into intelligence that organizations can investigate, verify, and act upon.