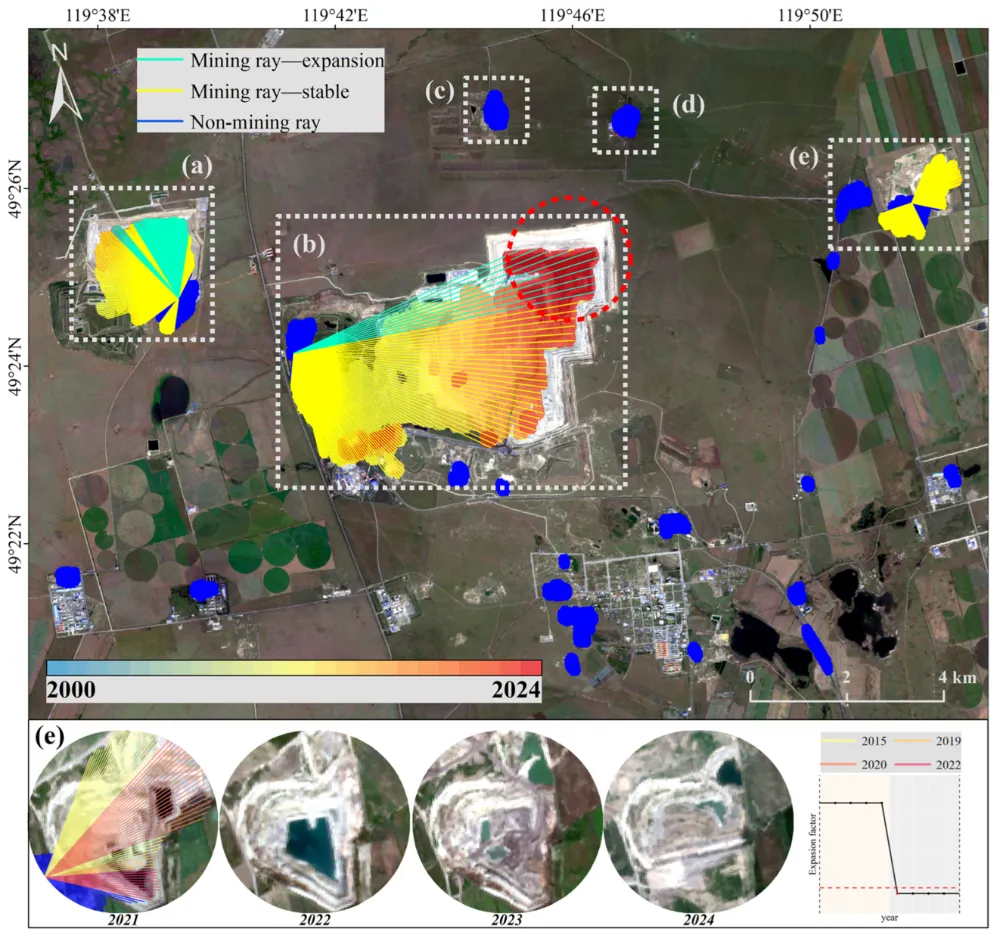
Multi-temporal satellite imagery can reveal where a mine’s surface footprint is expanding, which facilities are changing, and how surrounding land is being affected. Reliable monitoring, however, requires more than placing two images side by side. The images must be comparable, the changes must be linked to specific mine features, and the findings must be checked against independent evidence.
For a mine operator, the question may be whether new clearing matches the development plan. For an environmental team, it may be how much vegetation has been converted to disturbed land. For an investor, it may be whether visible development is consistent with reported progress. Each question requires a different measurement—and a different standard of evidence.
1. Define What “Expansion” Means
Start by separating the legal concession boundary, the approved development area, and the visible operational footprint. A concession may contain extensive undeveloped land. Activity inside that concession does not necessarily mean the extraction area has expanded, while a larger disturbed footprint may reflect roads, waste dumps, or supporting infrastructure.
Define the features to be mapped before selecting imagery. Keep extraction areas, stockpiles, waste dumps, roads, and surrounding land-cover changes in separate layers. This prevents several different types of development from being combined into one misleading expansion figure.
Also define the smallest change that matters to the business. Monitoring broad clearing across a large concession requires different imagery from measuring a narrow access road or a small stockpile extension.
2. Select a Baseline That Matches the Question
The baseline should represent a meaningful starting condition: before development began, before a planned expansion, or at the start of an agreed reporting period. The earliest available image is not automatically the best choice. It may contain cloud, poor illumination, or insufficient detail.
For annual monitoring, compare similar seasonal conditions where possible. A wet-season baseline and a dry-season follow-up can exaggerate vegetation loss or exposed ground. Review nearby dates and earlier years to understand the site’s normal seasonal pattern.
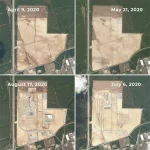
A useful monitoring program keeps both a fixed baseline and a rolling comparison. The fixed baseline shows cumulative development; comparison with the previous valid observation shows recent activity. Record the acquisition date, sensor, processing level, usable coverage, and reason for selecting each image.
Where clouds require a multi-date composite, retain the observation dates behind it. A composite assembled over several weeks represents a time window, and different parts of the mine may have been observed on different days.
3. Match Imagery to the Features Being Measured
Landsat’s 30 m multispectral imagery can support long-term analysis of extensive disturbance and surrounding land cover. Sentinel-2 offers 10 m visible and near-infrared bands, with shortwave-infrared bands at 20 m, making it useful for screening larger changes in vegetation, exposed ground, and site development.
Commercial imagery at meter or sub-meter resolution can provide more detail for delineating roads, smaller facilities, and complex boundaries. The required resolution depends on feature width, contrast, terrain, and the measurement tolerance. A feature occupying only a few pixels may be visible without being reliably measurable.
Resampling a 20 m band to a 10 m grid does not create 10 m spatial detail. Similarly, replacing an older coarse image with a newer high-resolution image can make previously unresolved features appear to be new. Keep the long-term comparison at a defensible common scale, and use finer imagery for detailed interpretation.
Plan updates around the decisions they support. Monthly screening may suit gradual development, while a major construction phase may justify more frequent observations. Actual update frequency depends on usable acquisitions, tasking availability, and processing time.
4. Make the Images Comparable Before Detecting Change
Preprocessing should address geometry, reflectance, and observation quality. Two images can look different even when the ground has not changed.
- Align the images. Use a common coordinate system and pixel grid, then check alignment against stable features outside the active mine. Misregistration can produce false change along every road, pit edge, and vegetation boundary.
- Use consistent radiometry. For spectral analysis, prefer surface-reflectance products and apply the documented scaling and offsets. Avoid calculating change from separately contrast-stretched display images.
- Mask unusable observations. Exclude cloud, cloud shadow, snow, missing data, and other unreliable pixels. Inspect the mine itself rather than relying only on the scene-wide cloud percentage.
- Review illumination and terrain. Different sun and viewing angles can alter pit-wall shadows and the appearance of steep slopes. Orthorectification and an appropriate elevation model help, but residual errors still need inspection.
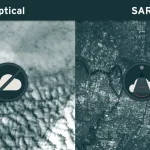
- Check sensor consistency. Different sensors have different spectral responses and processing histories. Cross-sensor analysis requires harmonization or a method validated for those differences.
NASA’s Harmonized Landsat and Sentinel-2 products illustrate this approach through atmospheric correction, cloud and shadow masking, view-angle normalization, spectral adjustment, and a common 30 m grid. Such products can support broad time-series analysis, while detailed mine features may require finer-resolution data.
Only calculate change where both observations are valid. An obscured area should be reported as unobserved, rather than treated as unchanged or removed from the mine footprint.
5. Detect Candidate Changes, Then Interpret Them
Begin with visual comparison using consistent display settings, including true-color and suitable false-color views. Look for coherent changes: a pit edge moving outward, a new road connected to an existing haul network, or clearing next to a waste dump.
Spectral differences can help identify candidate areas. A decline in the Normalized Difference Vegetation Index (NDVI) may indicate vegetation removal, while changes in visible and shortwave-infrared reflectance can help characterize exposed surfaces. Neither signal identifies mining by itself. Dry vegetation, harvested fields, natural rock, and construction sites may produce similar responses.
For a small number of sites, consistent manual delineation may be practical. Larger portfolios may benefit from classification or segmentation models. In either case, use the same class definitions across dates and validate performance on local conditions. A model trained on a vegetated coal-mining landscape may perform differently at an arid quarry.
After interpretation, convert accepted changes into feature polygons. Measure newly occupied land, changes within existing facilities, and transitions between land-cover classes separately.
Gross expansion and net change answer different questions. Gross expansion measures newly affected land outside the earlier footprint. Net change also accounts for areas that leave the mapped class. Reporting only the net figure can hide new disturbance when other areas are revegetated. Vegetation recovery should be reported separately until its meaning is verified.
6. Reject Seasonal and Observation-Driven False Changes
A candidate change becomes more credible when it remains visible in later usable observations and follows a plausible development pattern. Additional dates help distinguish persistent clearing from temporary effects, although persistence alone does not establish the cause.
- Seasonal vegetation: compare similar seasons and examine reference areas with similar vegetation outside the mine.
- Rainfall and soil moisture: check recent weather and additional dates before interpreting darker or brighter ground as excavation.
- Moving shadows: inspect sun geometry and pit slopes before accepting apparent boundary movement.
- Dust and haze: check quality flags and visual conditions; contaminated observations may need to be excluded.
- Water-level changes: distinguish newly exposed shorelines from new disturbance around ponds or tailings facilities.
- Unrelated land use: assess whether nearby clearing is connected to mine infrastructure, and verify it against plans or field information.
Research on automated mineral extraction-site detection has documented confusion with natural rock, water bodies, and deforested areas. Automated outputs therefore need site-specific review before they become operational findings.
7. Validate Both Detected Change and Possible Omissions
Verification should use evidence that is sufficiently independent of the detection process. Suitable sources include dated high-resolution imagery, drone surveys, field photographs, survey records, and mine development plans. Check that their dates match the period being assessed.
For routine screening, prioritize consequential or uncertain changes for review. To assess overall detection performance, also sample mapped unchanged areas: reviewing alerts alone cannot reveal missed expansion. Keep validation samples separate from model training data.
Report false detections and missed changes, and assess boundary or area uncertainty where those measurements matter. Small shifts close to the image resolution or registration error may remain inconclusive. Avoid hectare figures with more precision than the source data supports.
Satellite observations usually establish a change interval, rather than an exact event date. If a feature is absent in one clear image and present in the next, report that it appeared between those acquisitions. Cloud gaps may widen that interval.
Keep the interpretation within the evidence. A larger stockpile footprint does not establish tonnage; volume estimation requires suitable elevation data or surveys. Visible disturbance beyond a supplied boundary warrants review, but its legal status requires current permits and authoritative boundary information. Surface imagery also does not directly measure underground mining expansion.
8. Deliver a Result That Supports Action
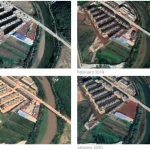
A useful monitoring report should connect each accepted change to a location, observation interval, feature type, measurement, confidence level, and verification status. Include before-and-after image extracts and a GIS layer that the mine team can compare with its plans.
For example, an illustrative report might identify 4.2 hectares of newly disturbed land beside a waste dump. If a later clear observation confirms the disturbance, the finding becomes stronger. Where part of its edge remains shadowed, show that uncertainty on the map and request targeted verification.
The operational response may be to check a development plan, inspect a new road, review disturbance near a sensitive area, or commission a detailed survey. Repeat monitoring with consistent definitions and documented processing so that changes in the report reflect changes on the ground.
For mining teams building this workflow, STARPATH GLOBAL can help match imagery resolution, observation intervals, and analysis methods to the features that matter. Explore our Mining solutions and imagery catalog, or discuss your site and monitoring requirements with our team to scope a pilot with agreed validation criteria. Teams developing their remote sensing capabilities can also explore the Pioneer Partner Program for support from our Forward Deployed Engineers.